A graph displays your data inside a topic in Trend Monitor. A graph can include one or multiple data series
Before you can create a graph, make sure the following is in place:
- Your data must be uploaded in the Penetrace platform.
- A monitor must have been created for you to add topics and graphs.
- A topic must have been created for you to add a graph.
To create a graph, follow these steps:
1. Enter your monitor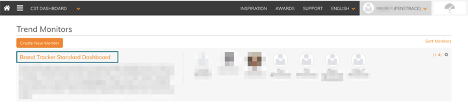
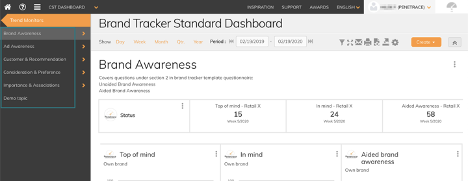
2. Enter one of your topics
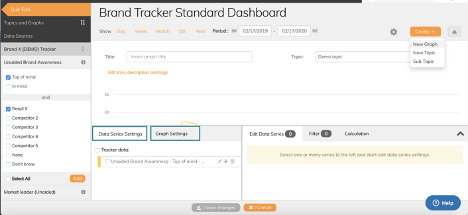
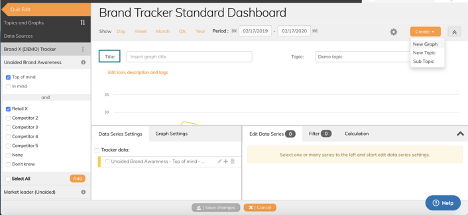
3. Click Create and New graph
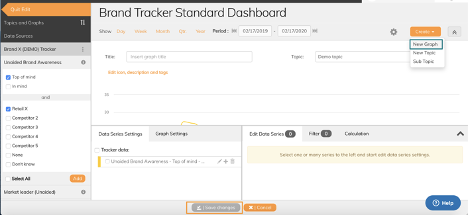
4. Add a data series from your data sources in the left menu
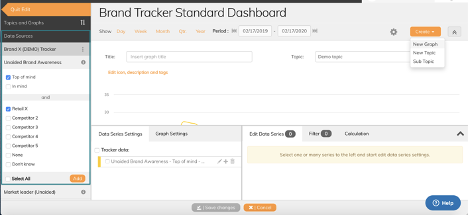
5. Set graph setting and data series settings.
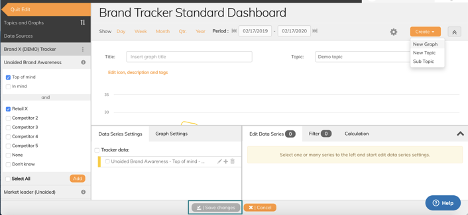
6. Add a title to your graph
7. Save changes
Now your graph is created.
Labels: Trend monitor, topic, graphs, graph settings, data series settings
Related Articles:
If you have any questions, do not hesitate to contact us on support@penetrace.com