This article guides you on how to download data from a graph to an excel file.
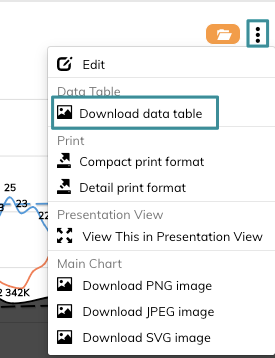
1. Click Edit on a graph and choose Download data table
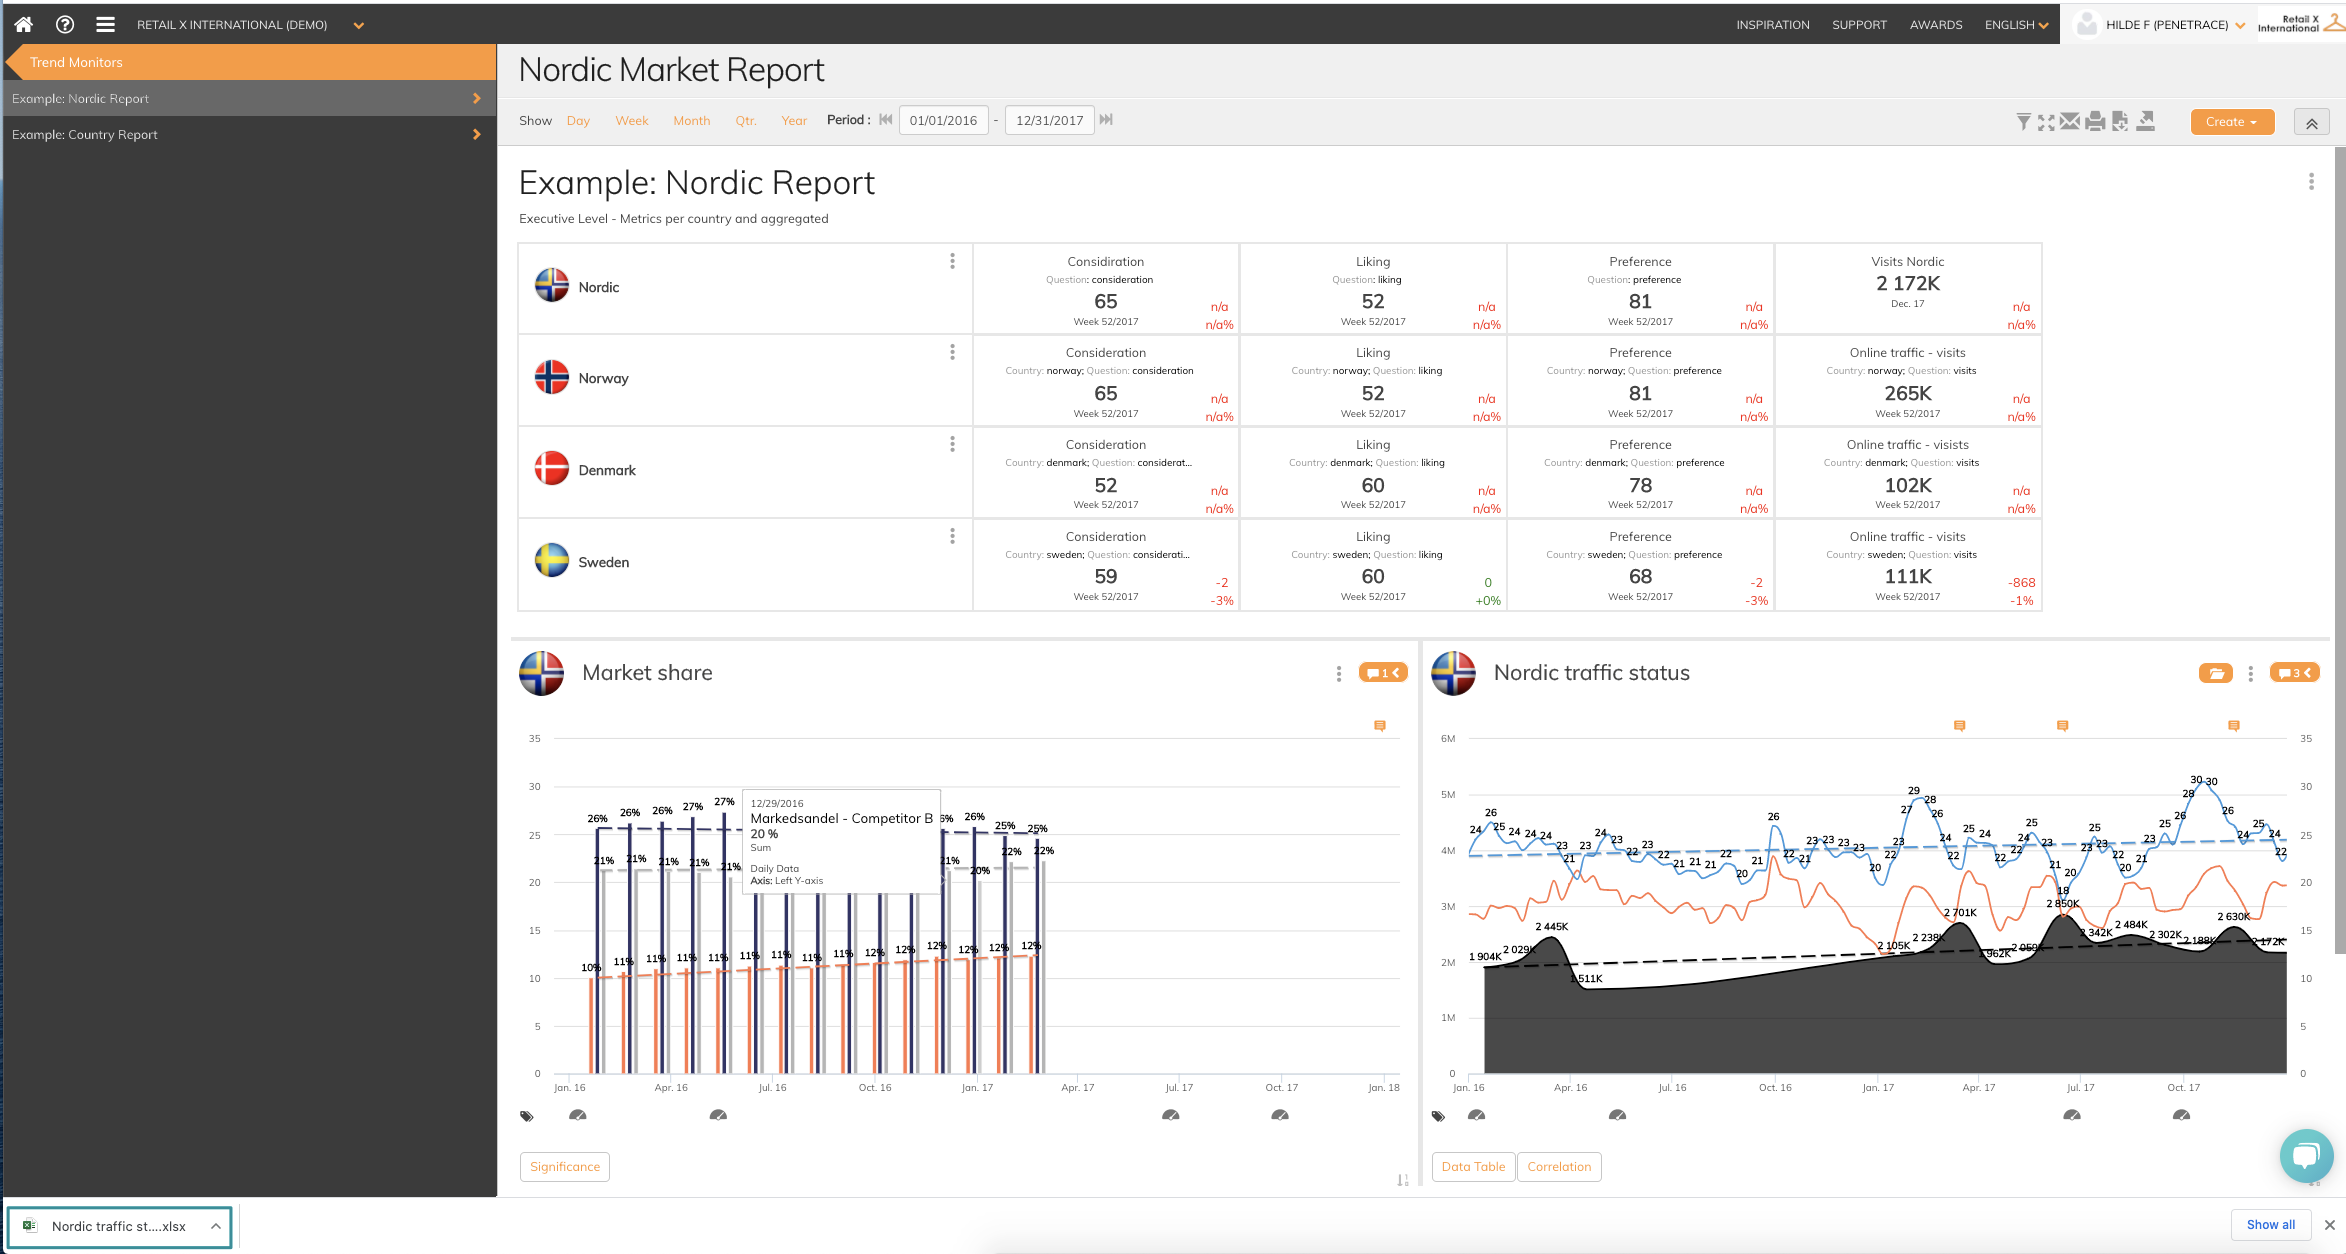
2. Click on the download in the bottom of your browser
The data is downloaded in excel and contains all data in the graph you downloaded.
You will find 2 sheets in the excel file:
- Sheet 1 contains a table with columns as the specified time level
- Sheet 2 contains a format optimized for creating a pivot table. This allows for more custom analytics with pivot- and excel features.
If you have any questions, do not hesitate to contact us on support@penetrace.com