This article applies to trend monitor.
Steps you have to take before you can set a period on a graph or topic:
- Access to your dashboard
Follow these steps
1. Enter a topic or a graph
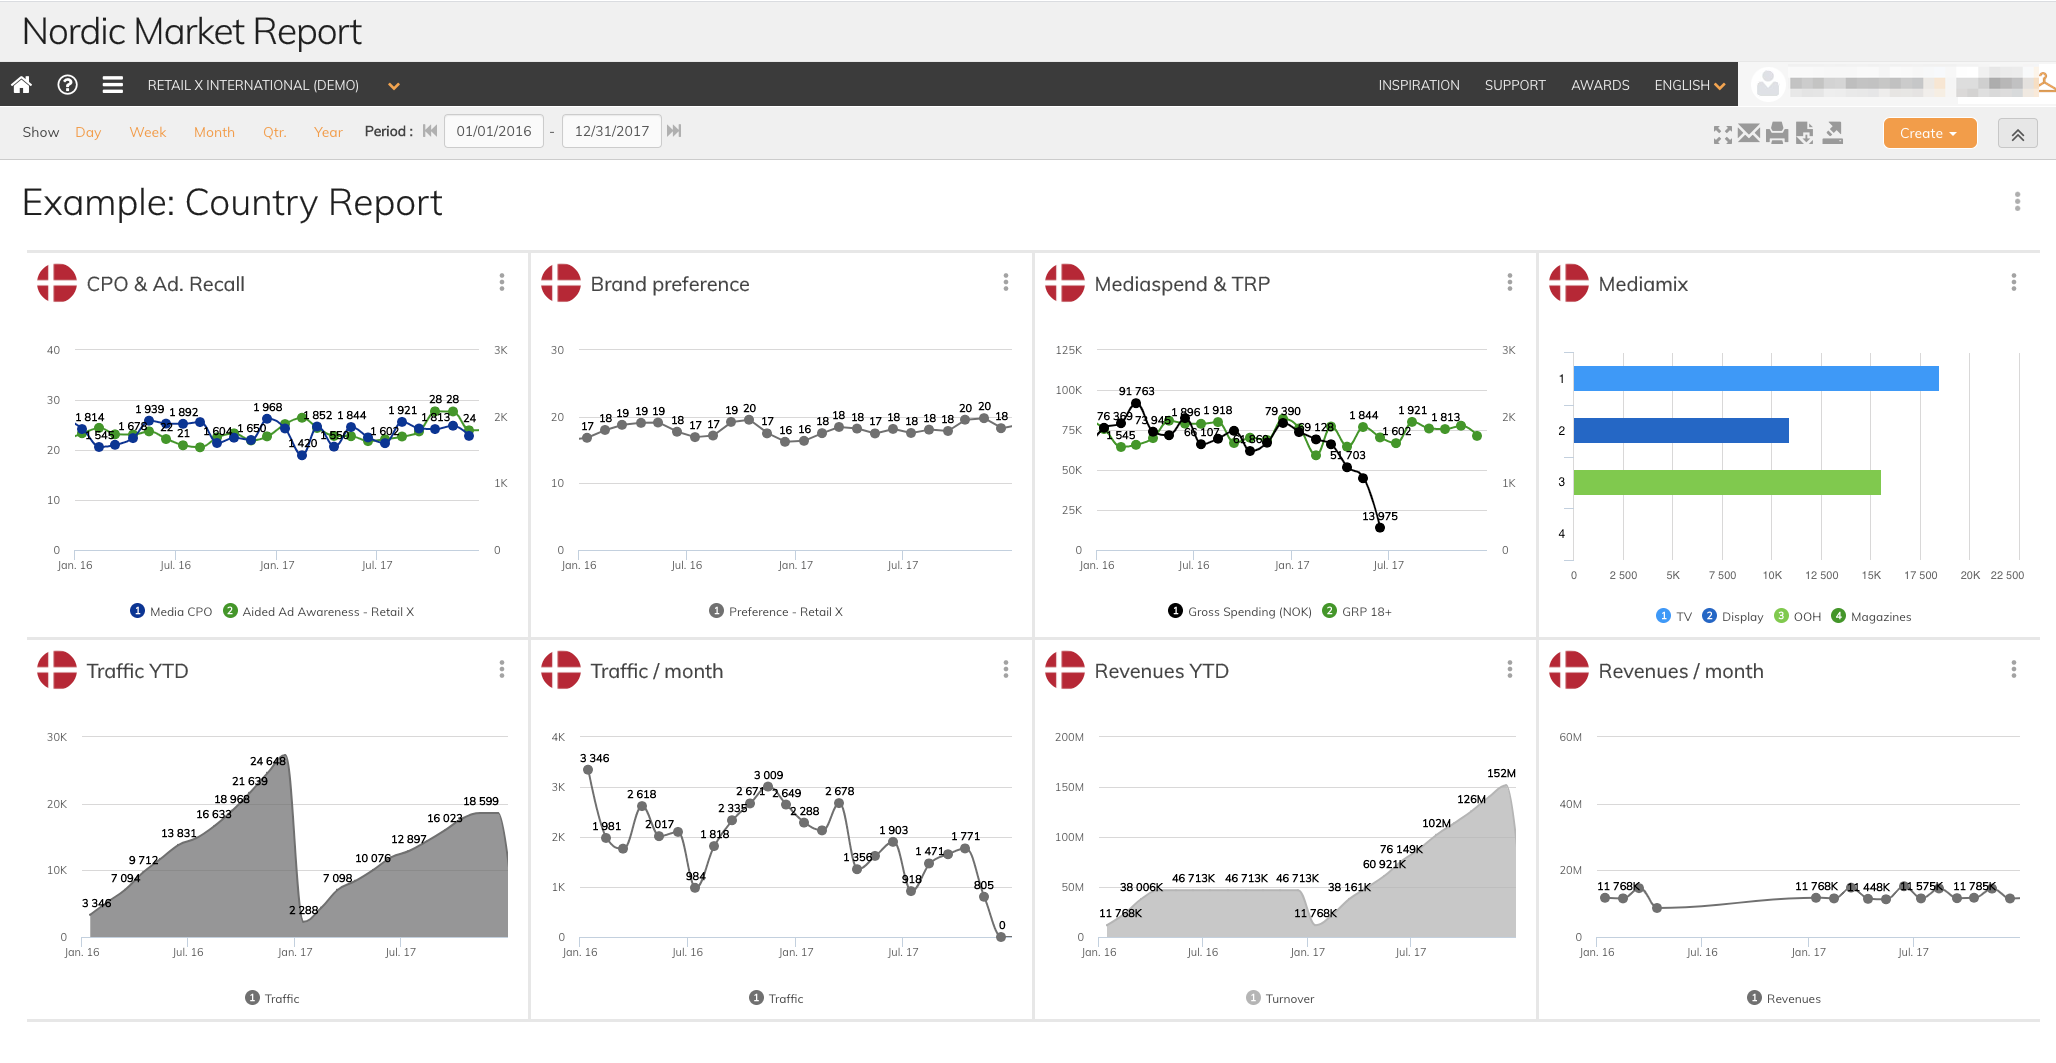
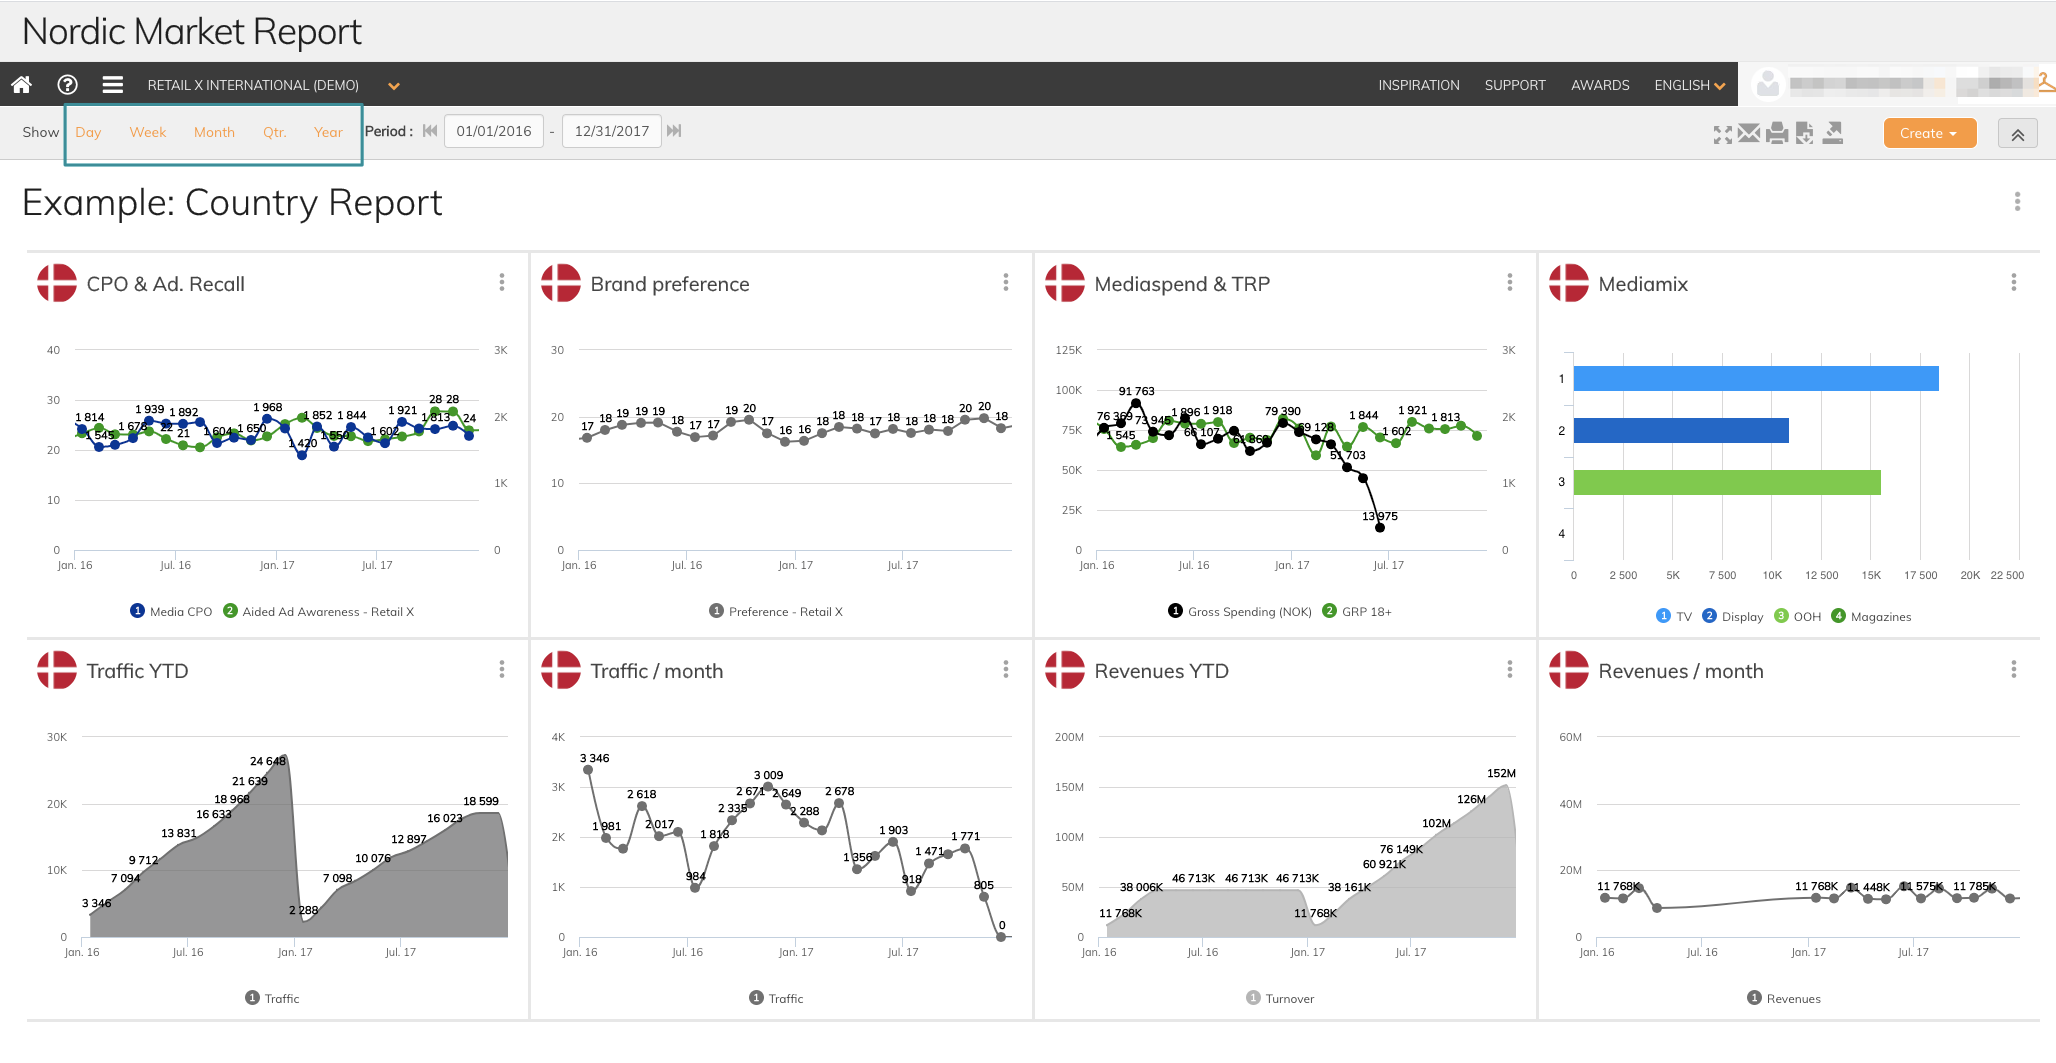
2. Choose which data period you want to display. Use the time navigation at the top of the screen to have all the graphs show data for the last year, quarter, month, week or day
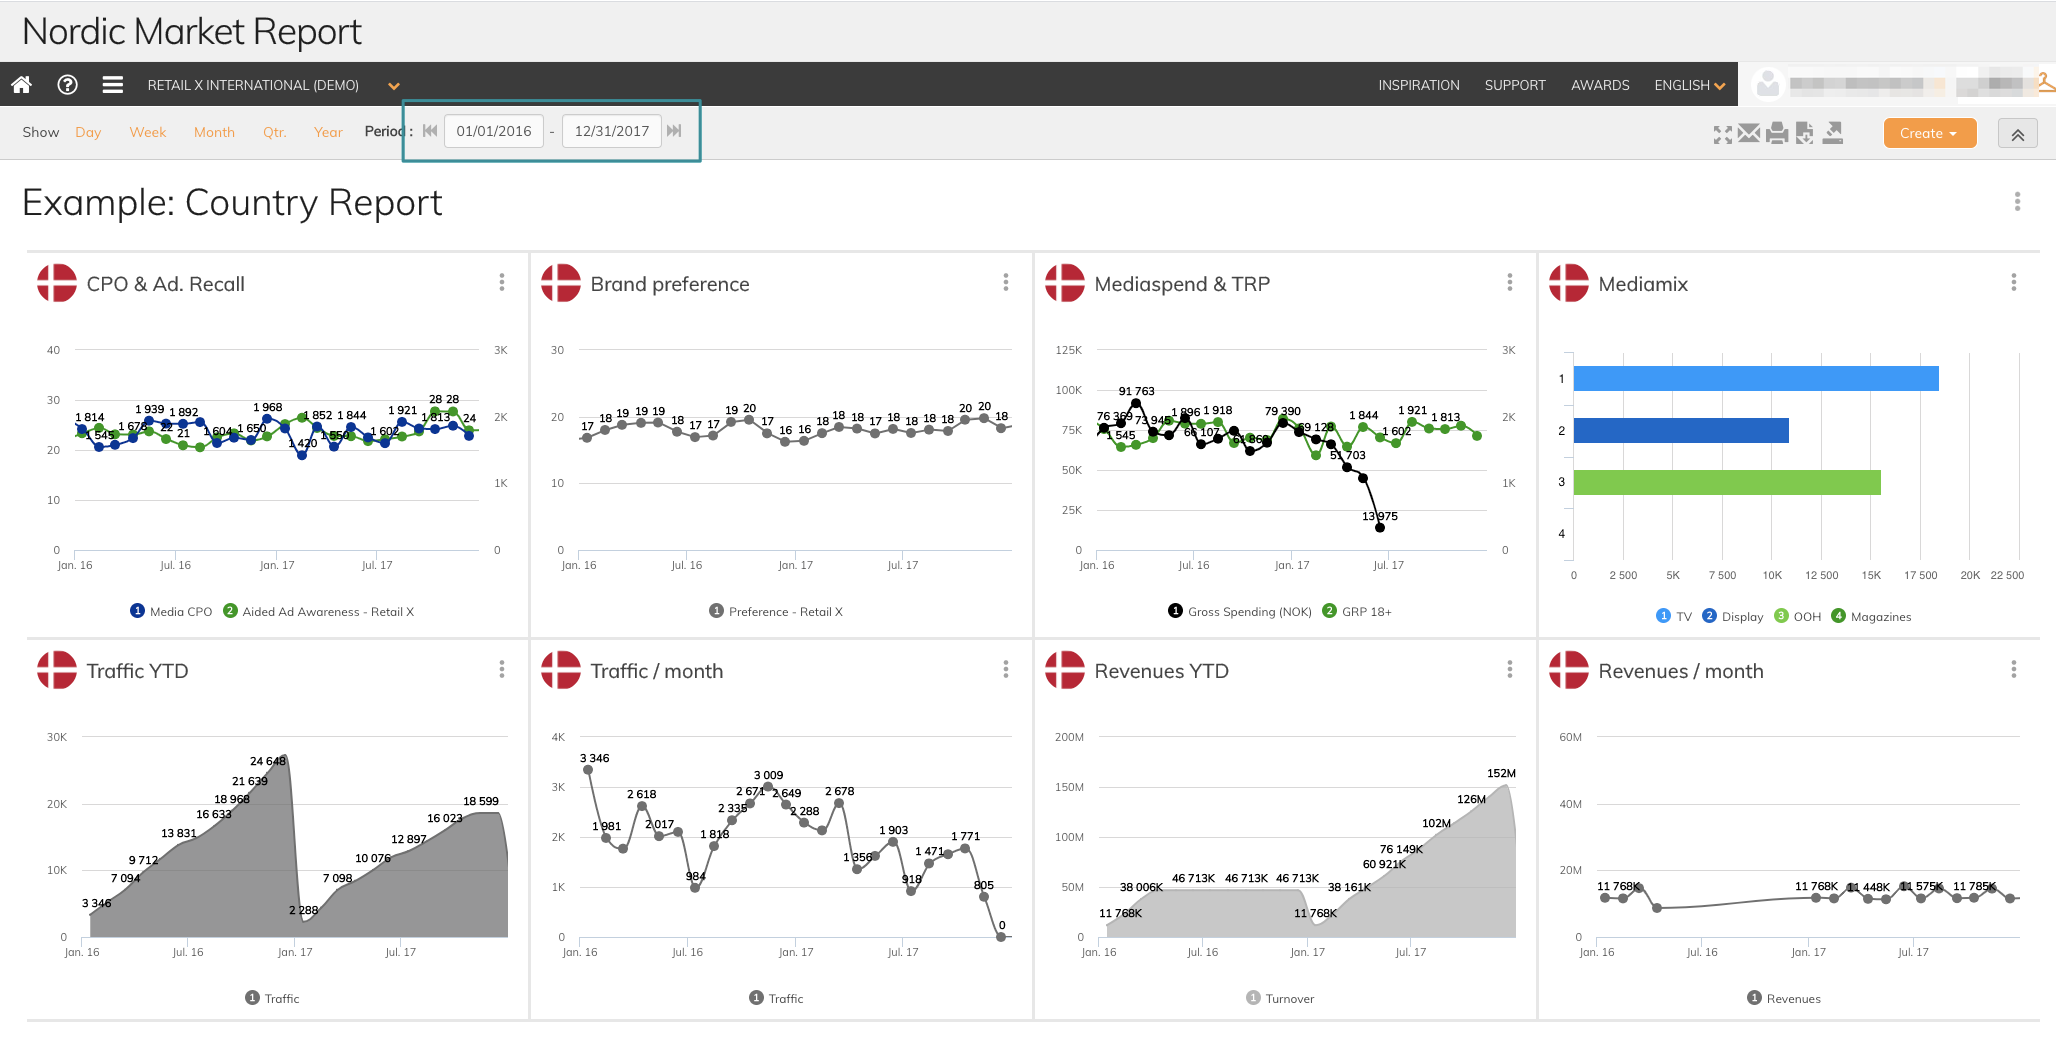
3. If you want to set your own custom date period use the data fields to the right
4. Each graph is also interactive, so you can click, and zoom in directly in the graph
to display a custom time period. Use your curser to mark the area your want to zoom in to.
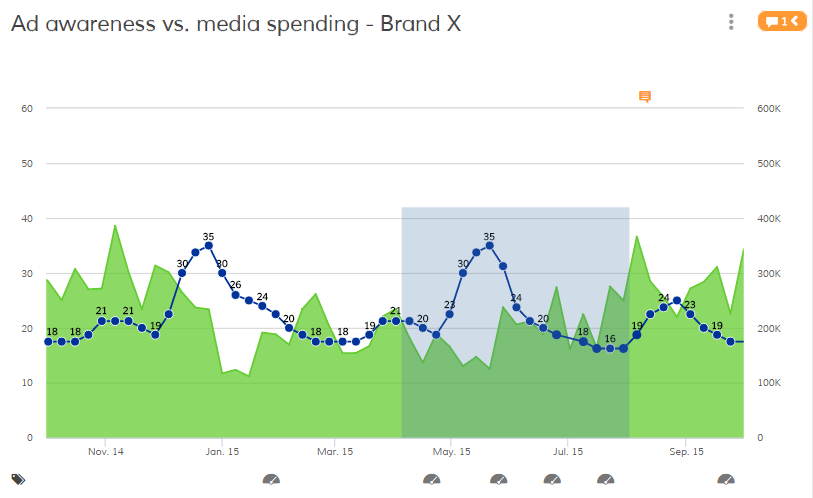
5. Reset zoom to get back to default view for your dashboard

The functions are also shown in this video
If you have any questions, do not hesitate to contact us on support@penetrace.com