- Help & support
- Trend Monitor
- Getting started on Dashboard
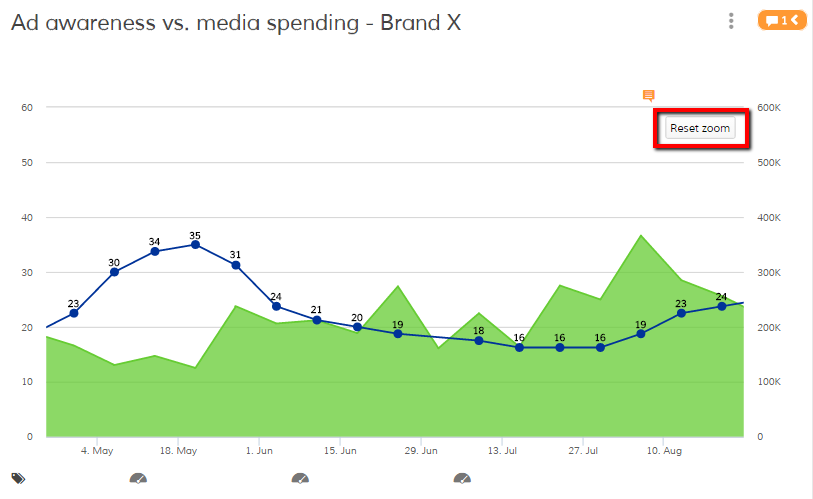
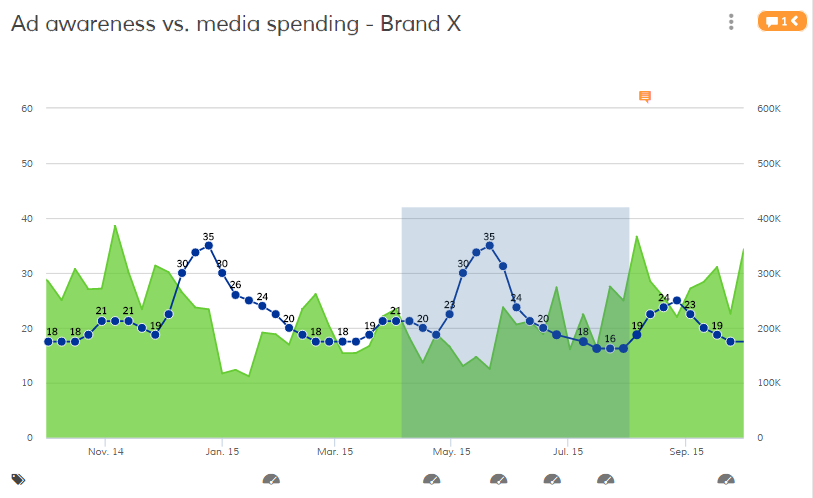
Zoom in a graph
Zoom
Each graph is interactive, so you can click, and zoom right in the graph
to display a custom time period.
After zooming, you can click the "Reset zoom" button in the graph to zoom back out.