This article will give you a detailed overview of how Penetrace is calculating correlation.
Applies to Trend Monitor
The correlation matrix is calculated to show the dependence between two or more data series. The input of this calculation is a set containing more than two data series. The result is a matrix representing the correlation between each pair of these data series. With a set of two data series, the matrix will be two by two, i.e. four members.
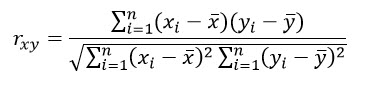
The correlation between the two data series is calculated according to the following equation:
Assume that we have a set containing three data series as follows:
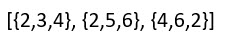
The correlation between the first two data series namely {2,3,4} and {2,5,6} is calculated as follows:
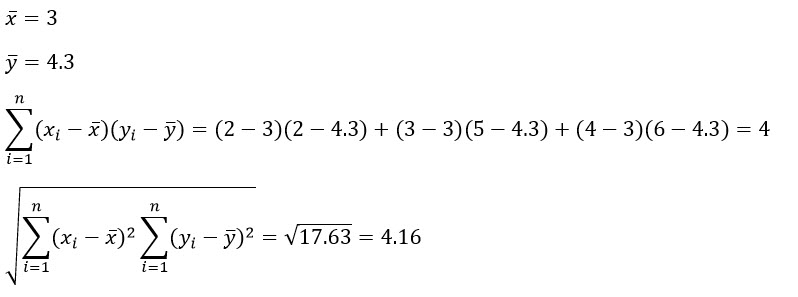
And finally:
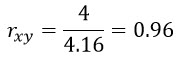
Note that the value of correlation can be between -1 and 1 where -1 means perfect negative correlation, 0 means no correlation at all and 1 means perfect correlation.
When all nine correlation values are calculated, we can form the resulting correlation matrix which looks like the following table.
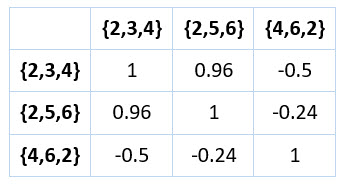
Since each data series is fully correlated with itself, the main diagonal entries in a correlation matrix are always 1. The correlation matrix is also symmetric as shown above.
If you want to know how to enable correlation to see the connection between data series in your dashboard, read this article.
If you have any questions, do not hesitate to contact us on support@penetrace.com