Correlation is a measure of how data series are related. This article will show you how to enable correlation in Penetrace for you to see relations between data series.
Applies to Trend Monitor
Correlation refers to functionality that let you run correlation analysis across different data sources with one click. If you want to know that connection between your investments and sales, or the connections between Facebook posts and people´s perception of your brand correlation can help you get answers.
To be able to enable correlations the following must be in place:
- Access to your dashboard
- Editor or admin access rights to your dashboard
- A graph with two or more data series
Follow these steps to enable correlation:
1. Click Edit on a graph with two or more data series
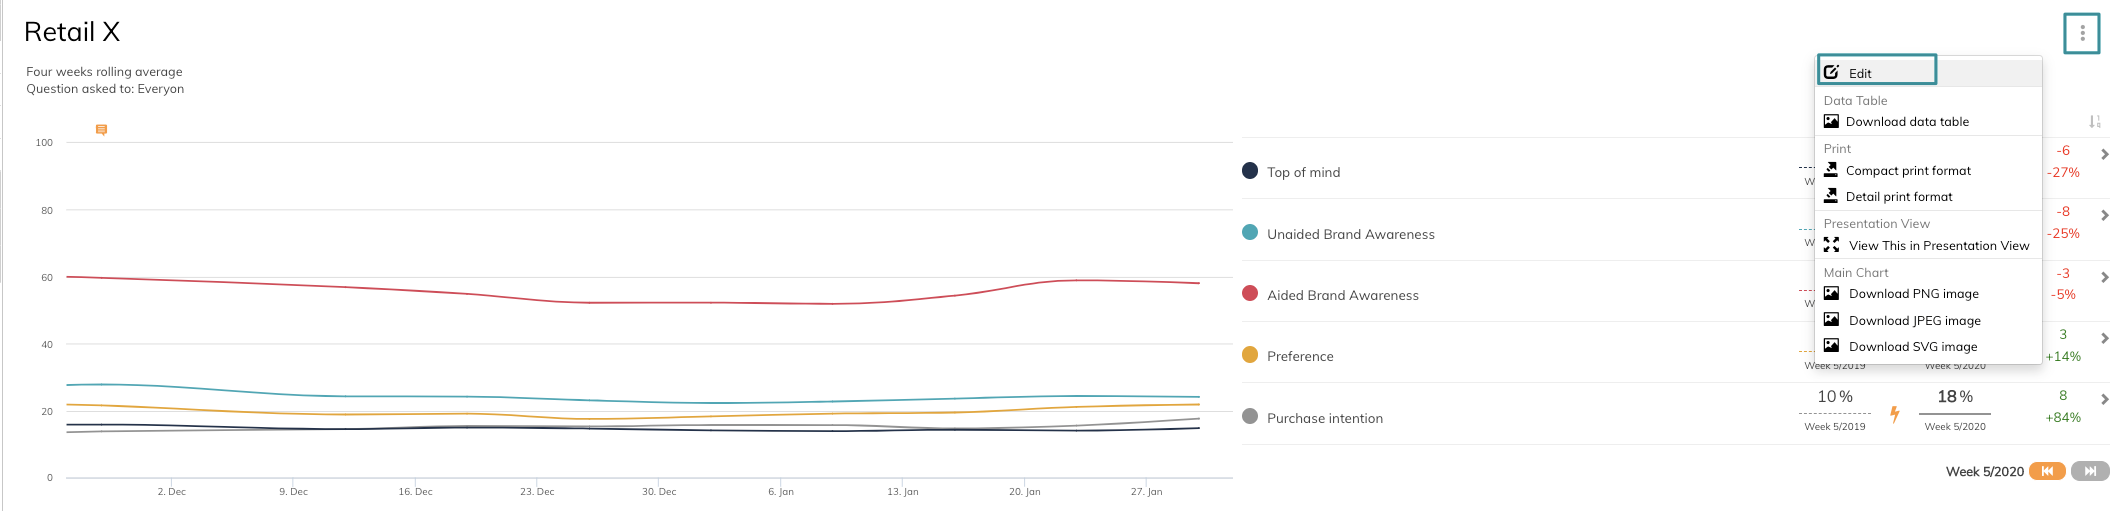
You are now in edit mode of the graph.
2. Tick off all data series (or the data series you want to see relations between)
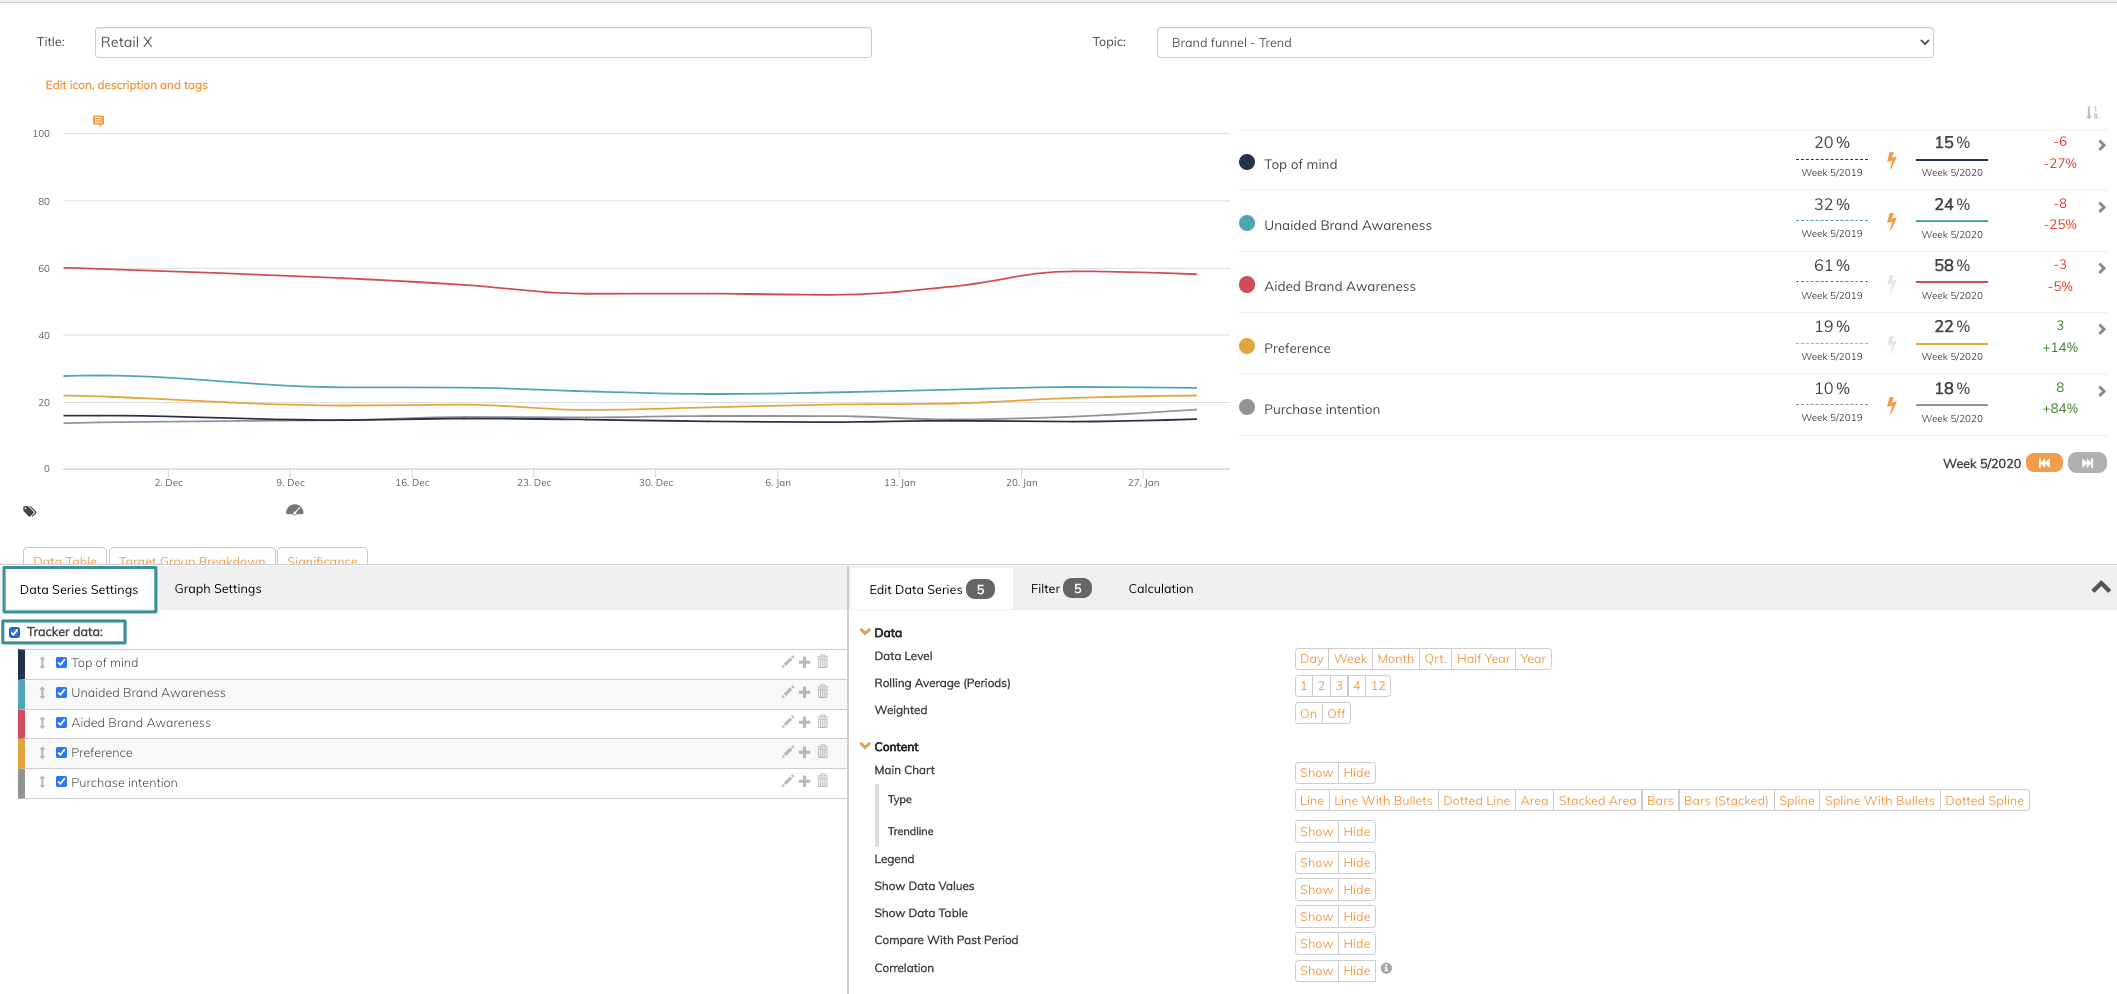
3. In Edit data series, click Show on Correlation
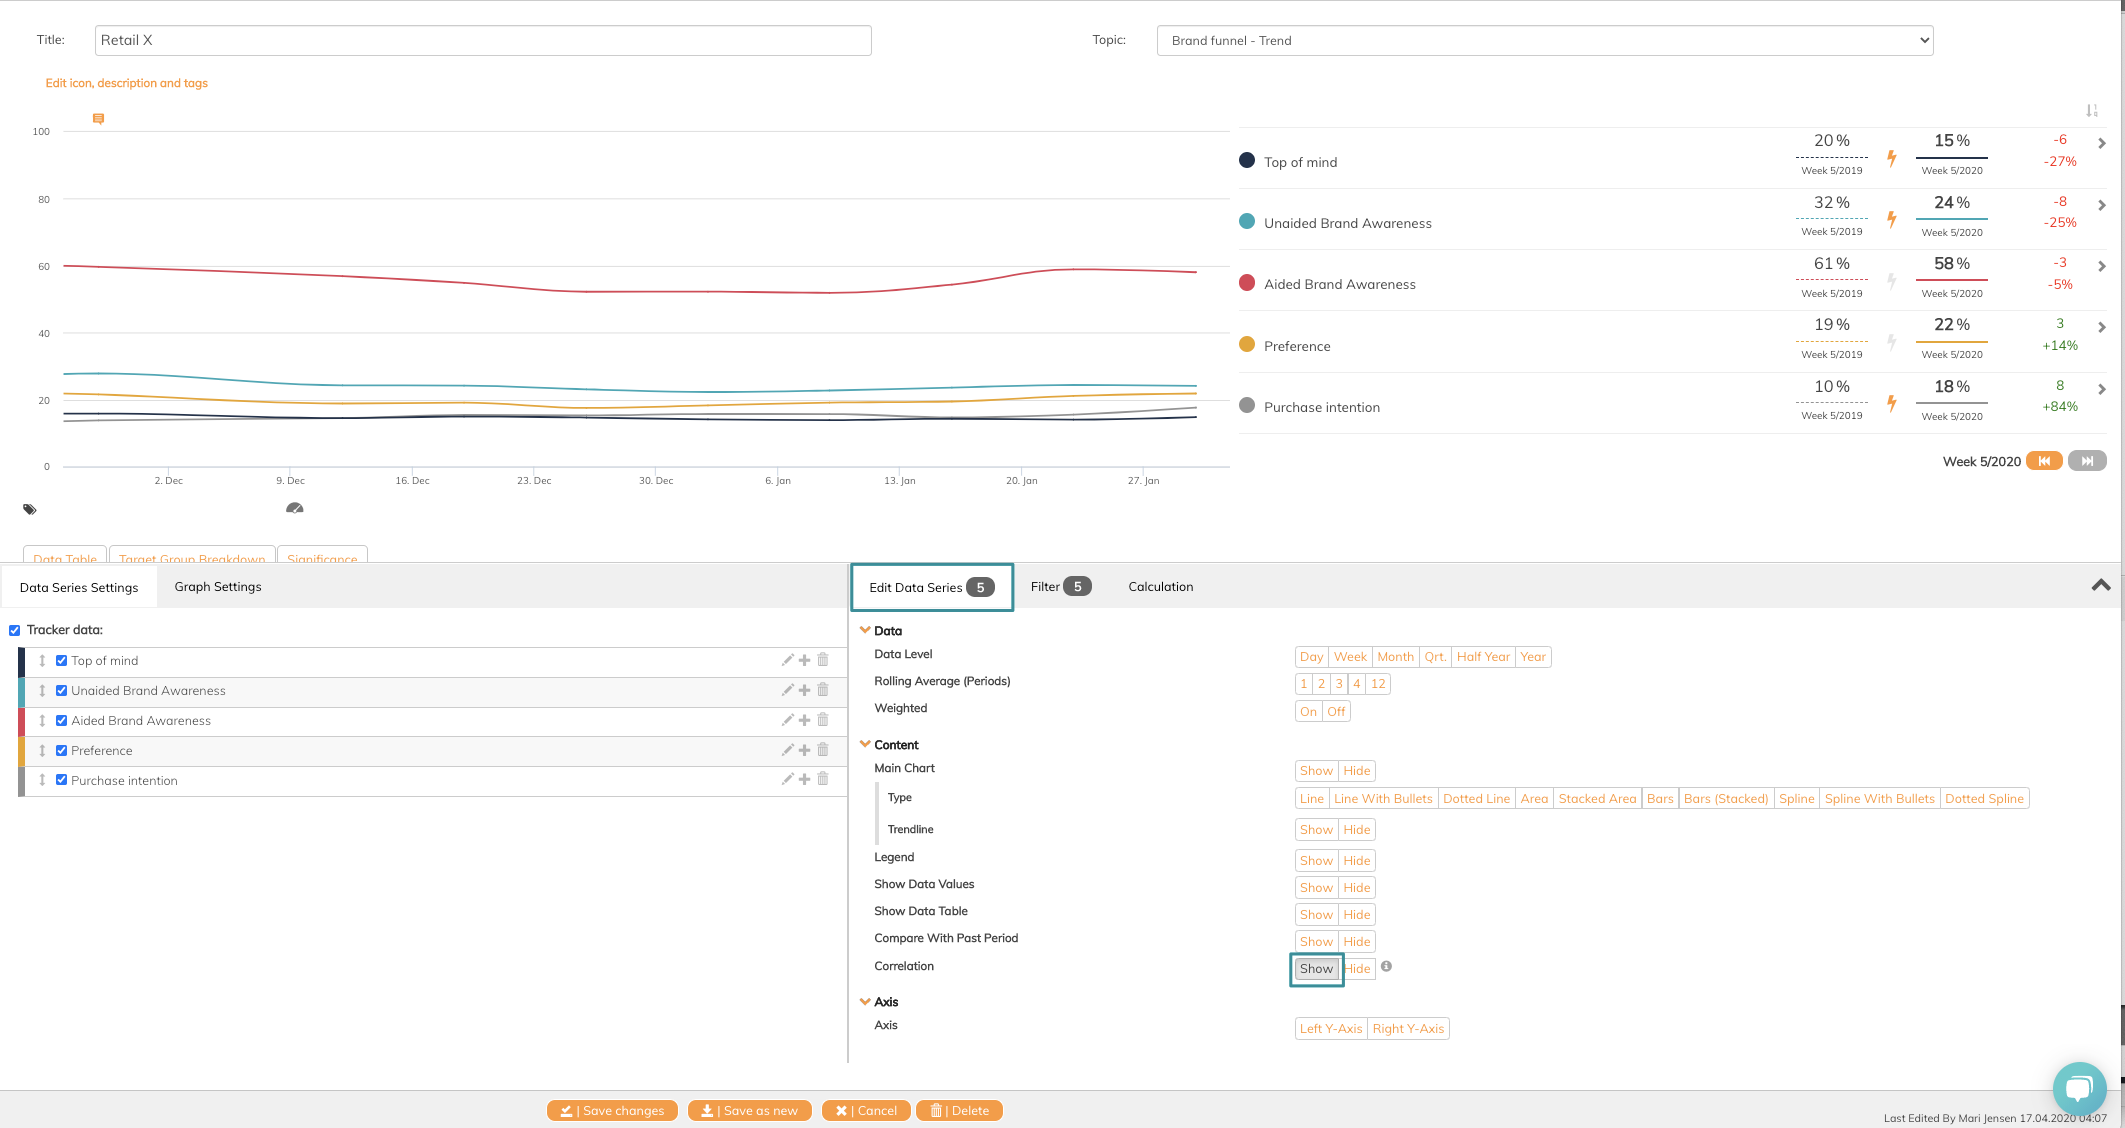
4. Click Save Changes
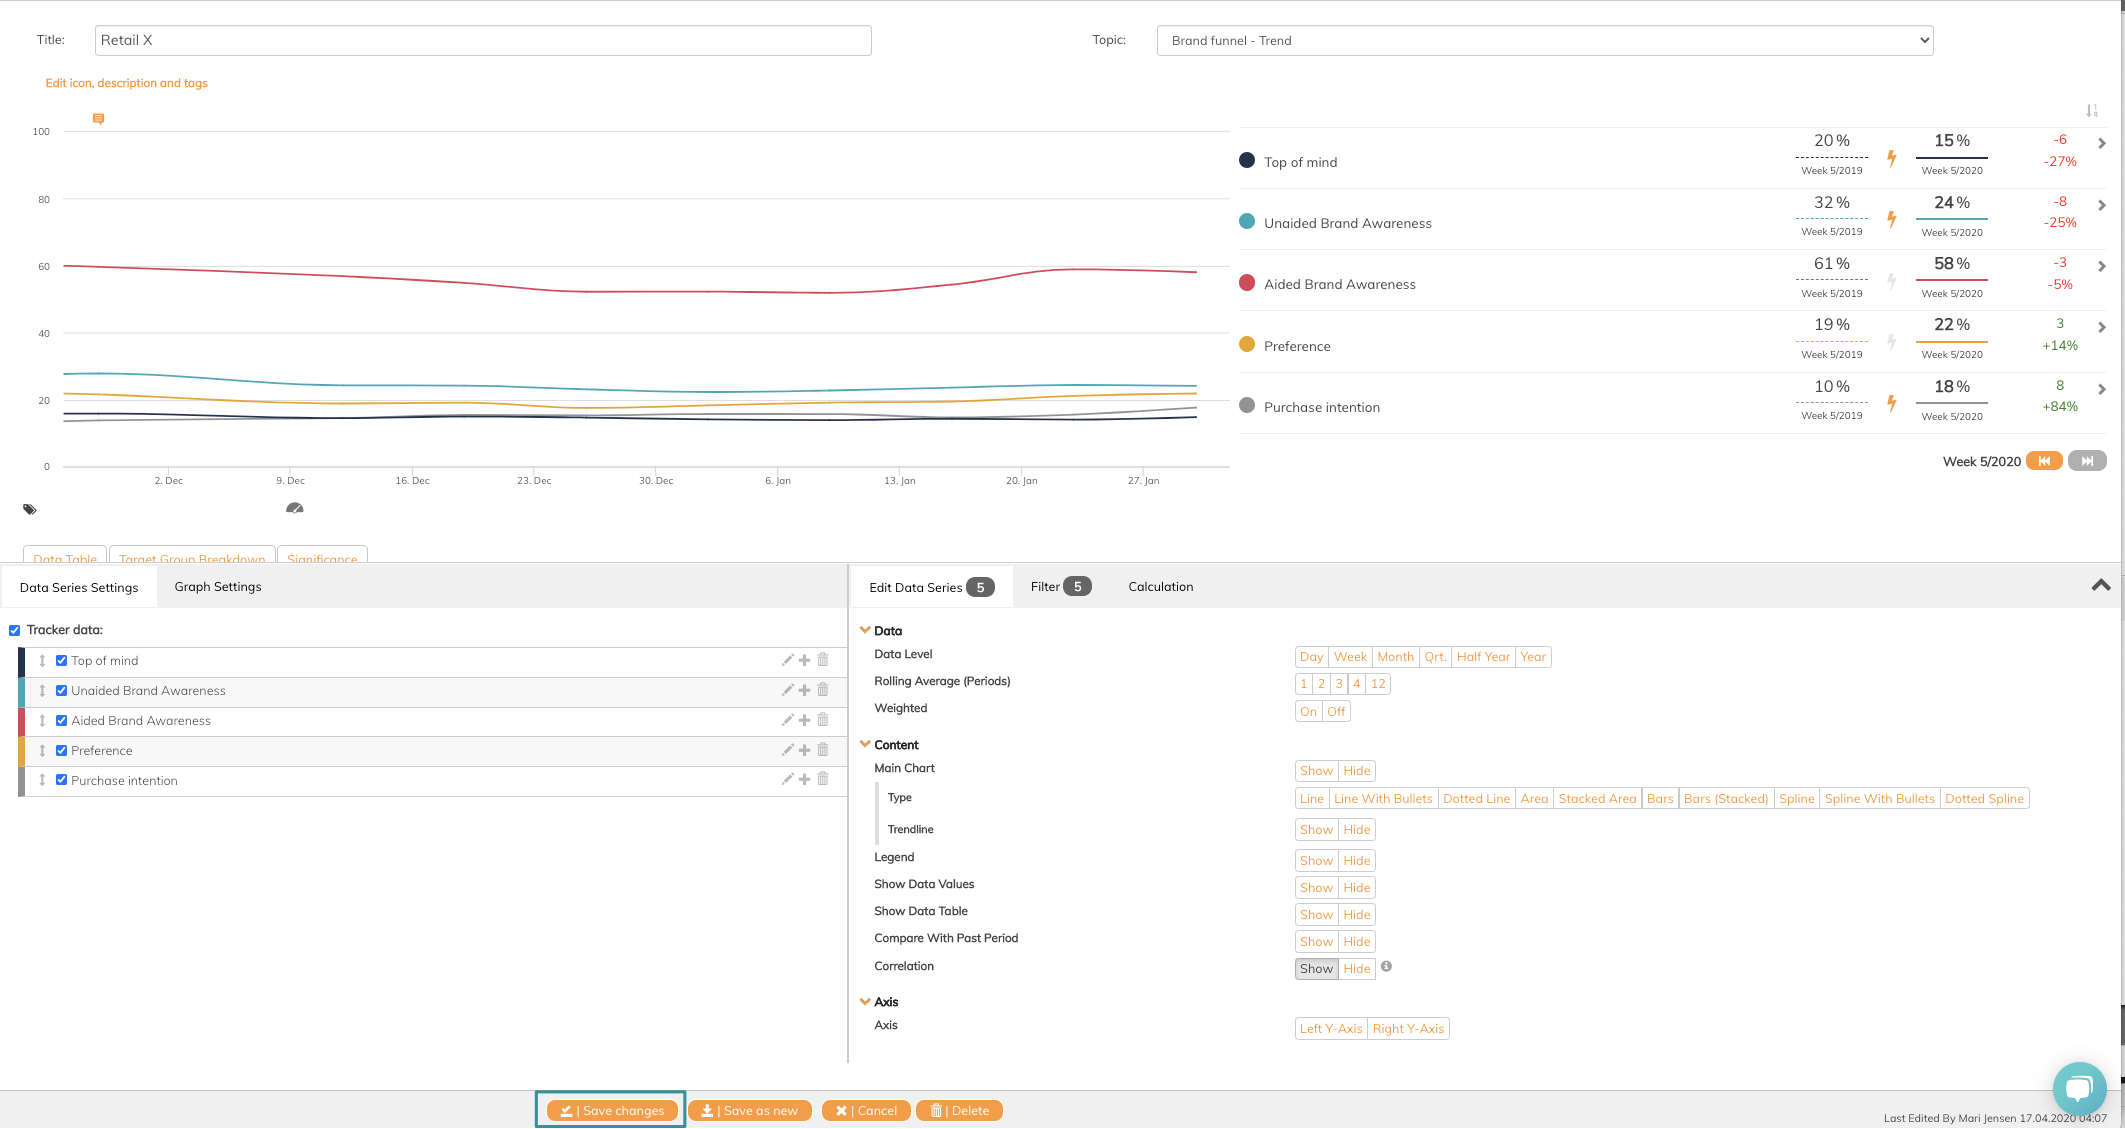
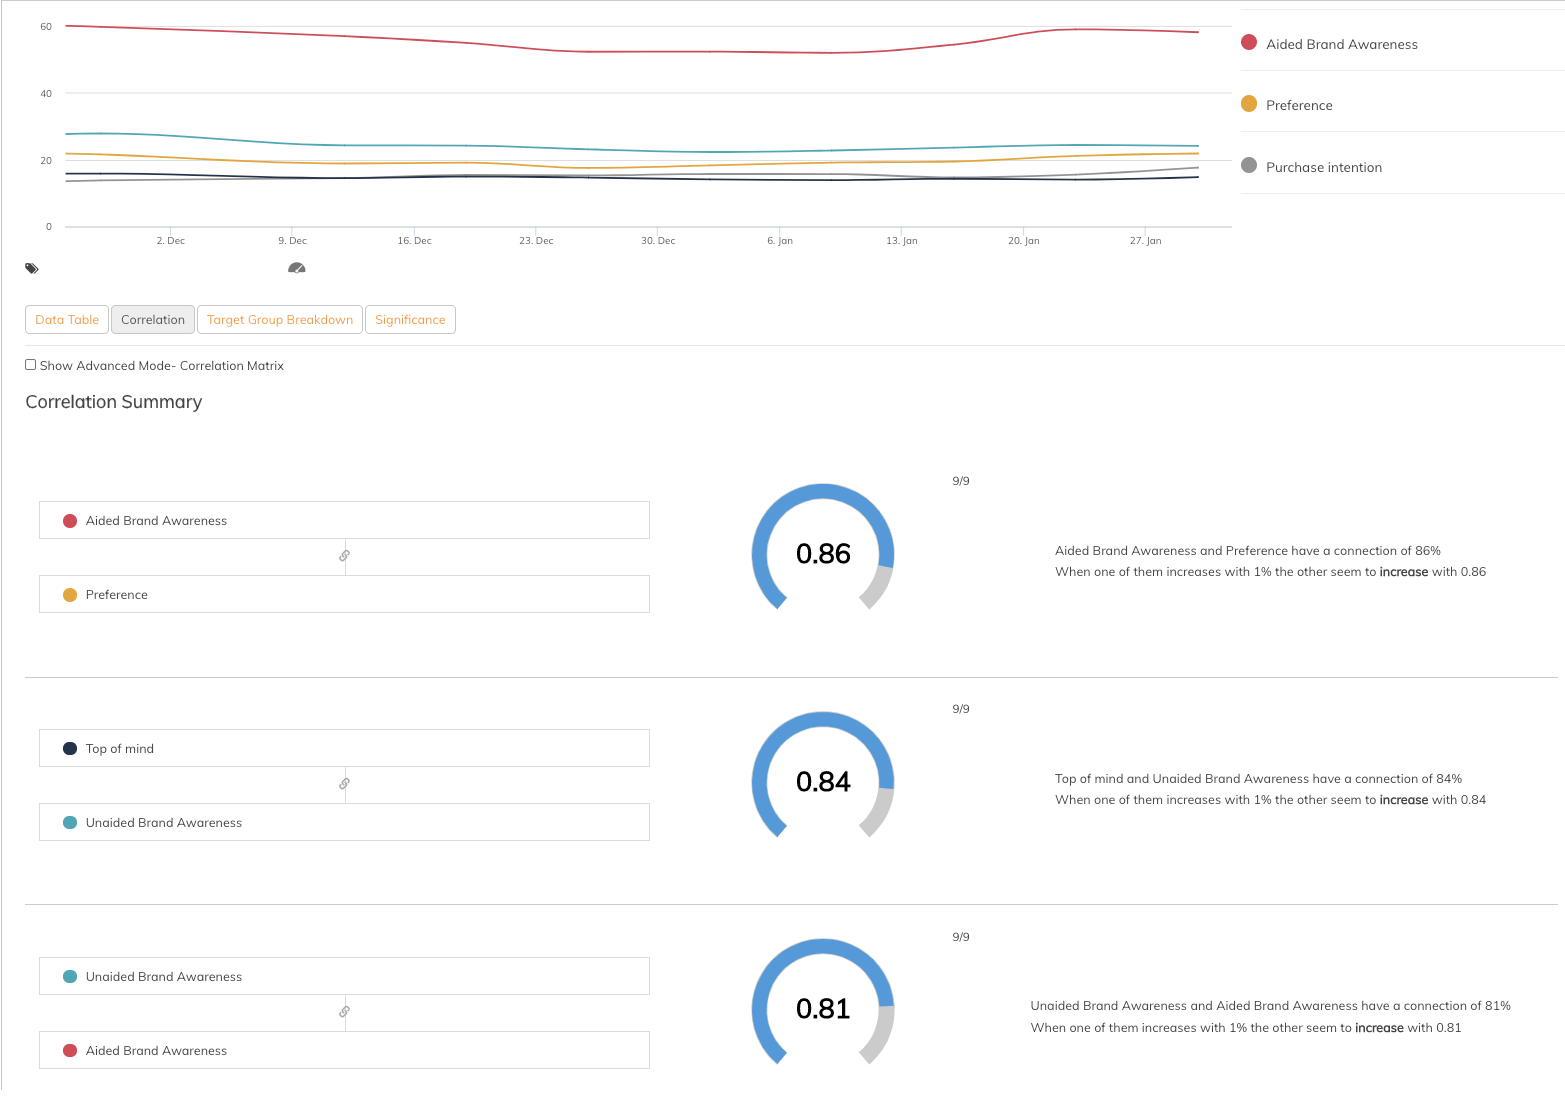
5. Click Correlation button enabled in the graph
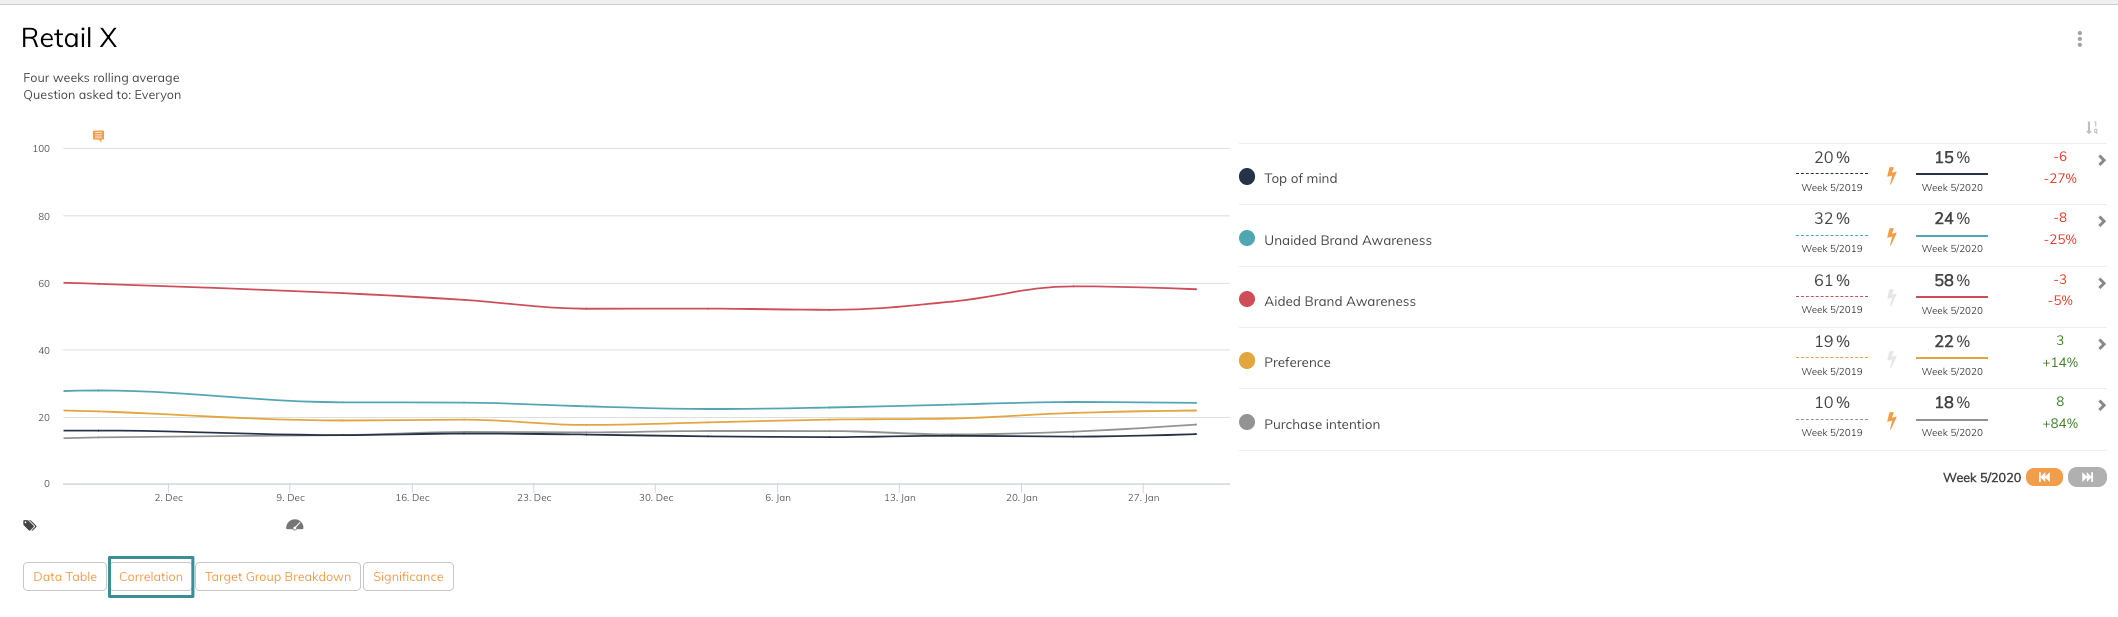
A correlation summary is now visible
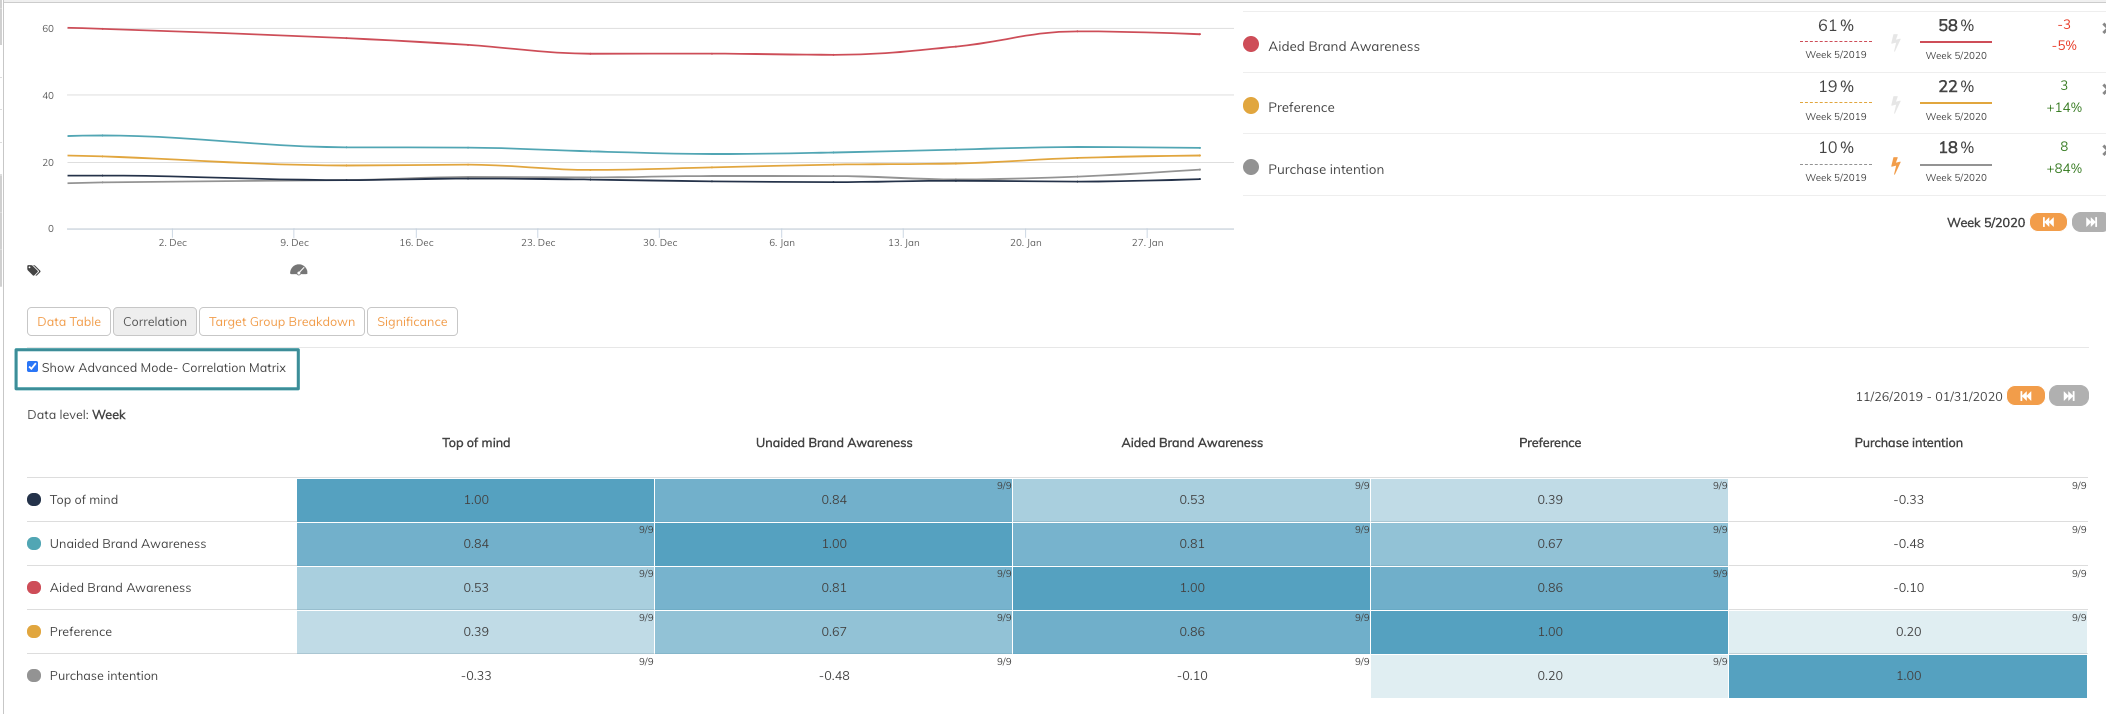
6. To see the correlation matrix, tick off the Show advanced mode - Correlation matrix
If you want to read more about the actual calculation, read this article.
If you have any questions, do not hesitate to contact us on support@penetrace.com