To make a more content-rich dashboard you can add icons to illustrate what the graph is supposed to visualise.
Applies to Trend Monitor.
In order to add icons to graphs, the following needs to be in place:
- Acces to your dashboard
- Edit access rights
- An already created graph
Follow these steps to add icons to a graph:
1. Click Edit in a graph
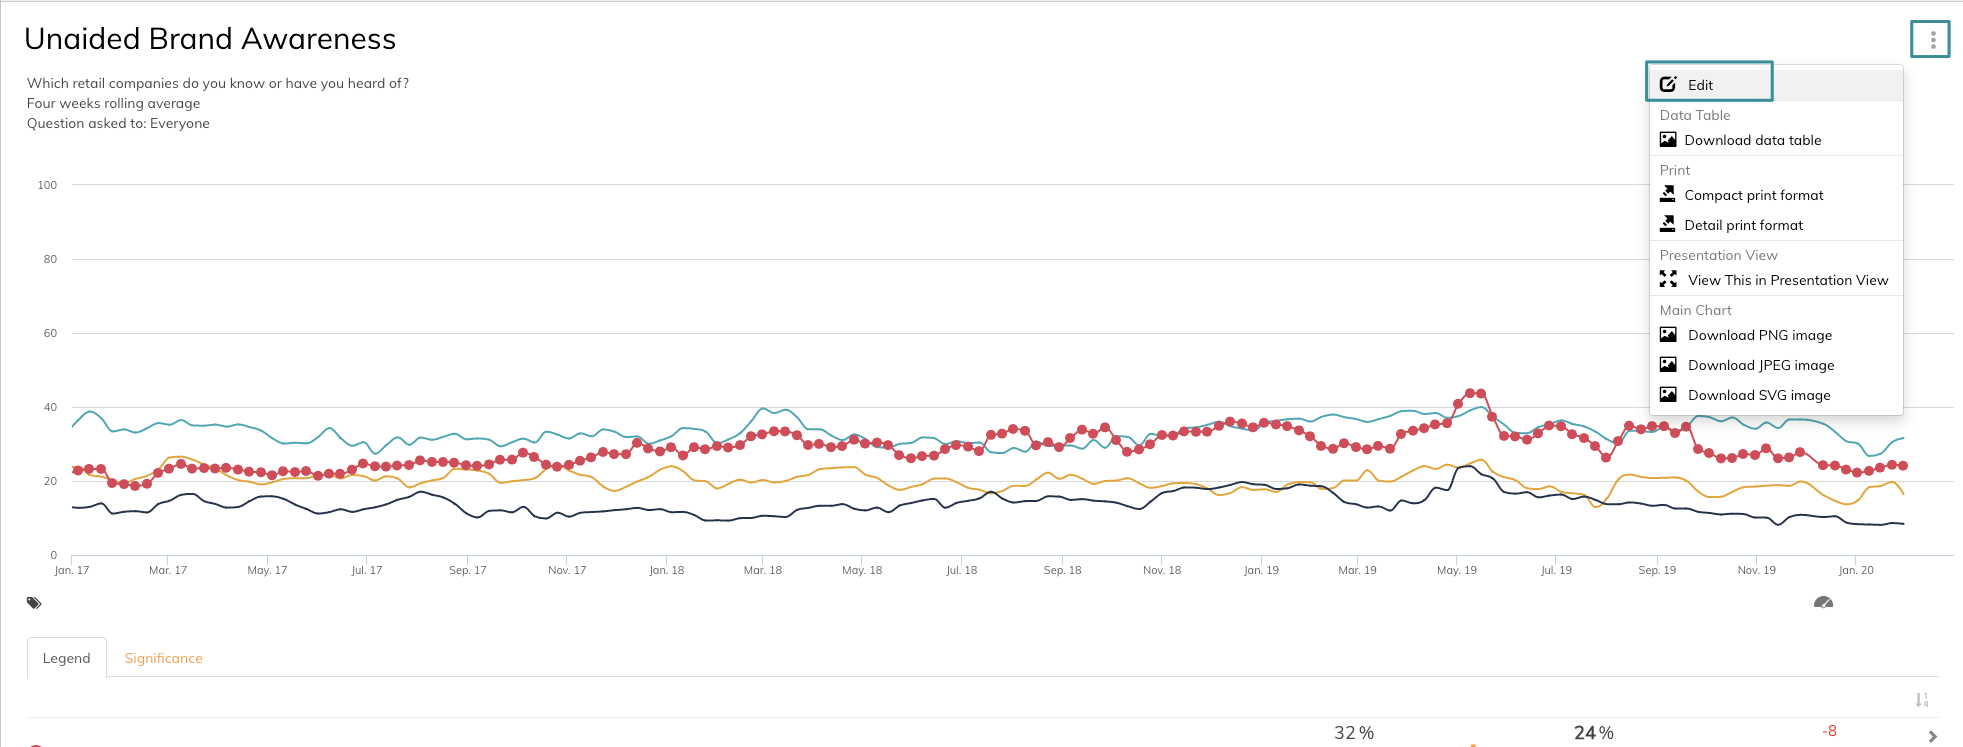
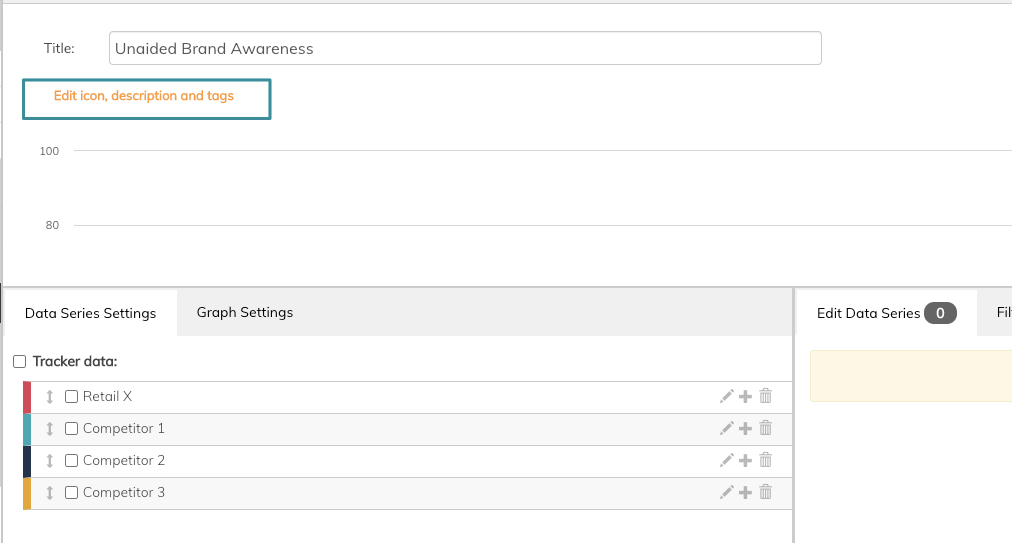
You now enter the edit mode of the graph.
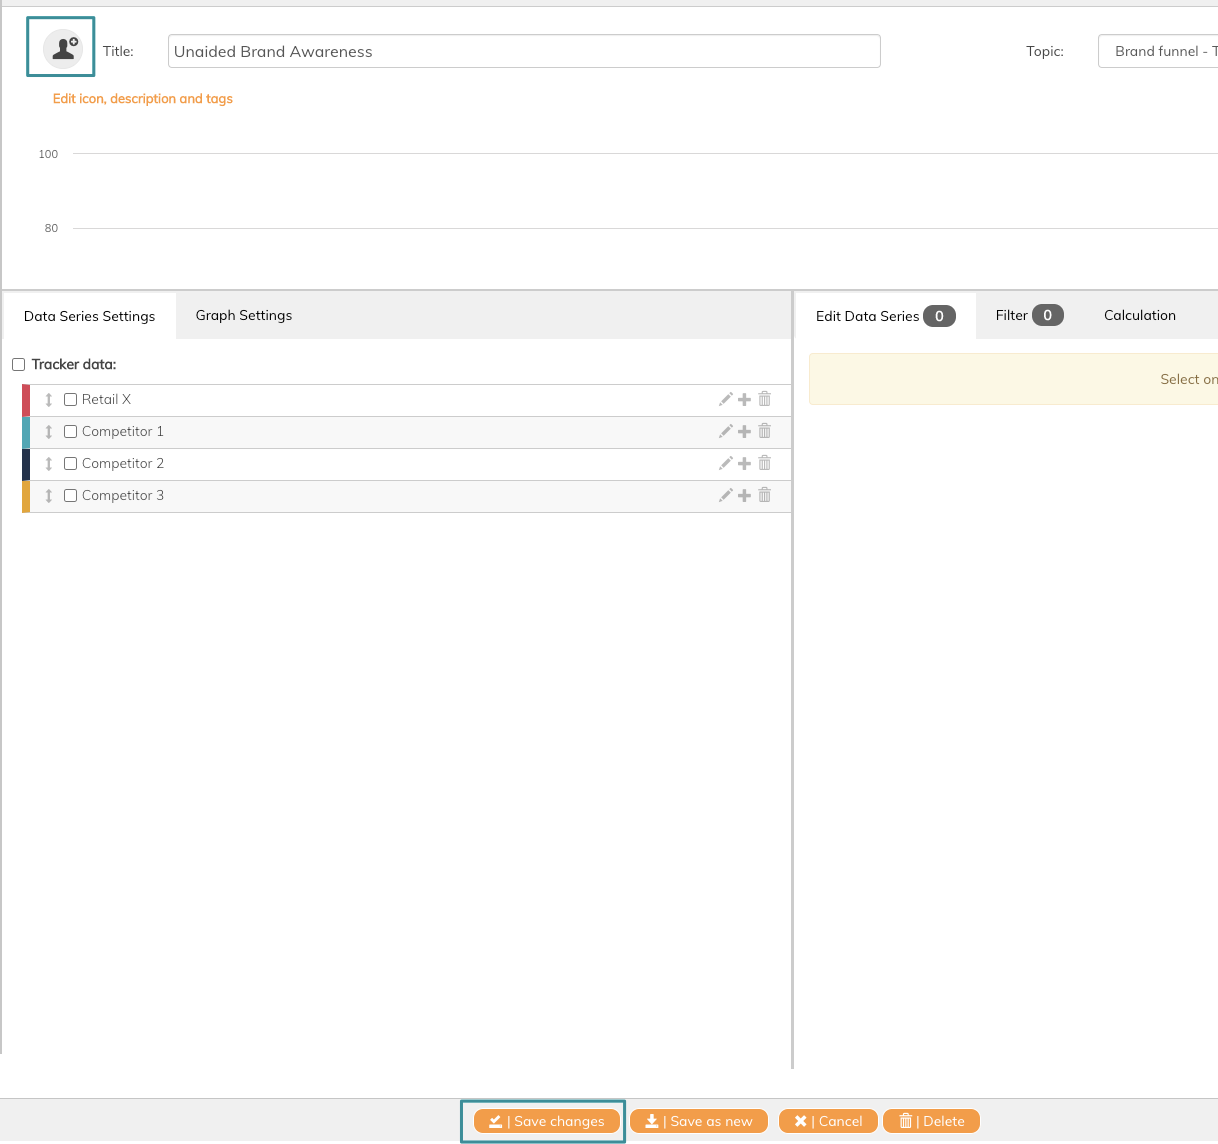
2. Click Edit icon, description and tags
3. Click on the tab Choose an icon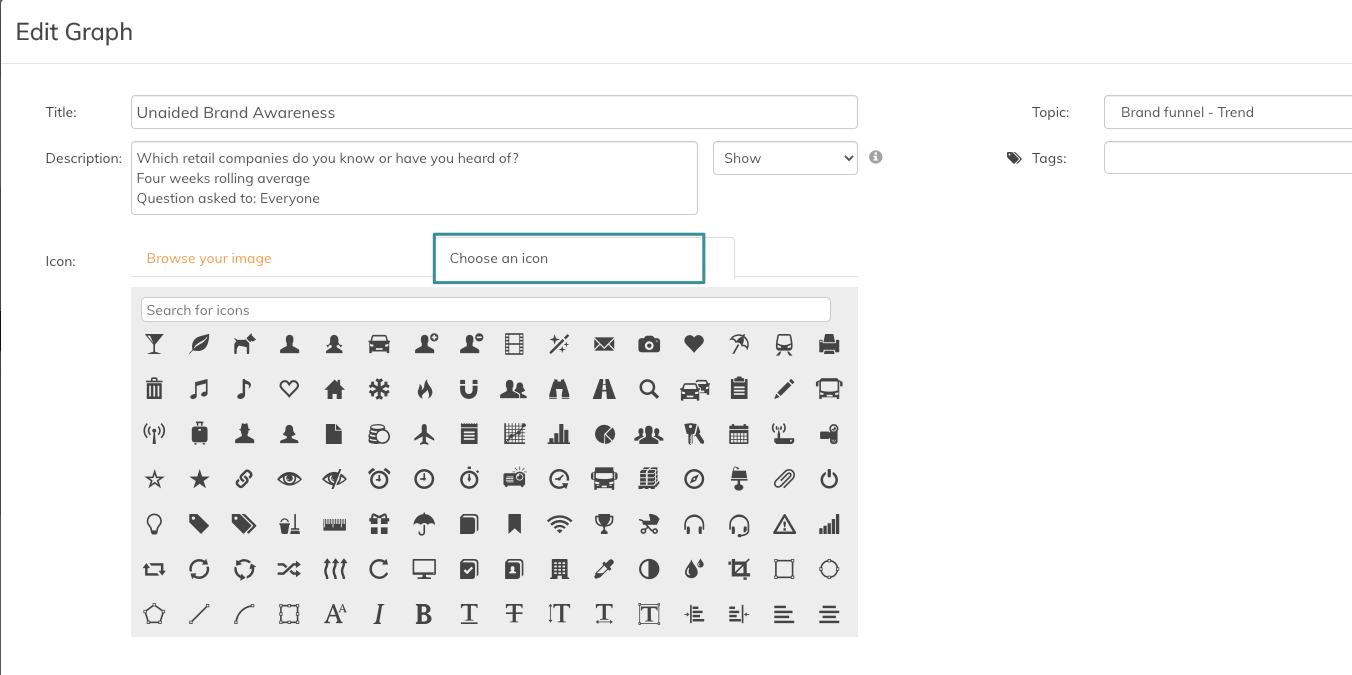
You now enter a variety of default icons to add to your dashboard. In this example, we are going to add an icon to a graph displaying Unaided Brand Awareness.
4. Search for a specific icon or scroll to choose between the icons
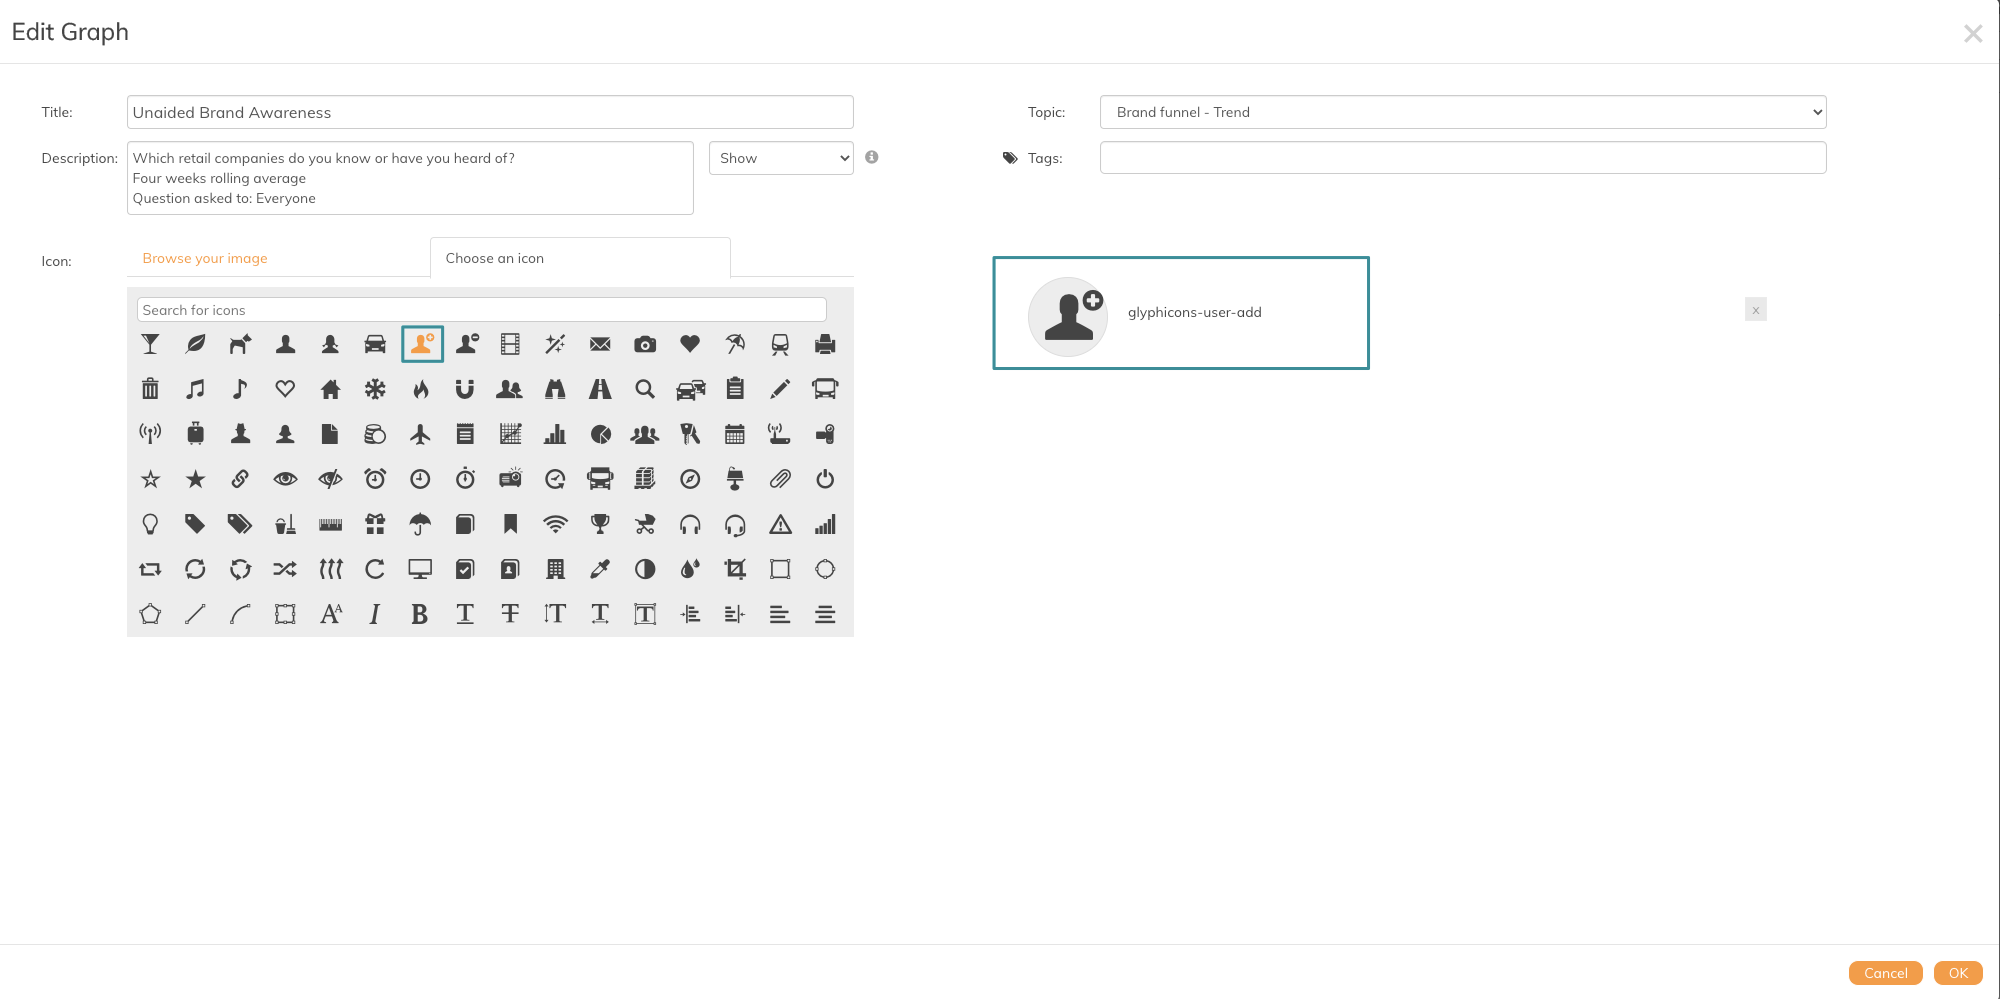
In this example, we use the User Add icon.
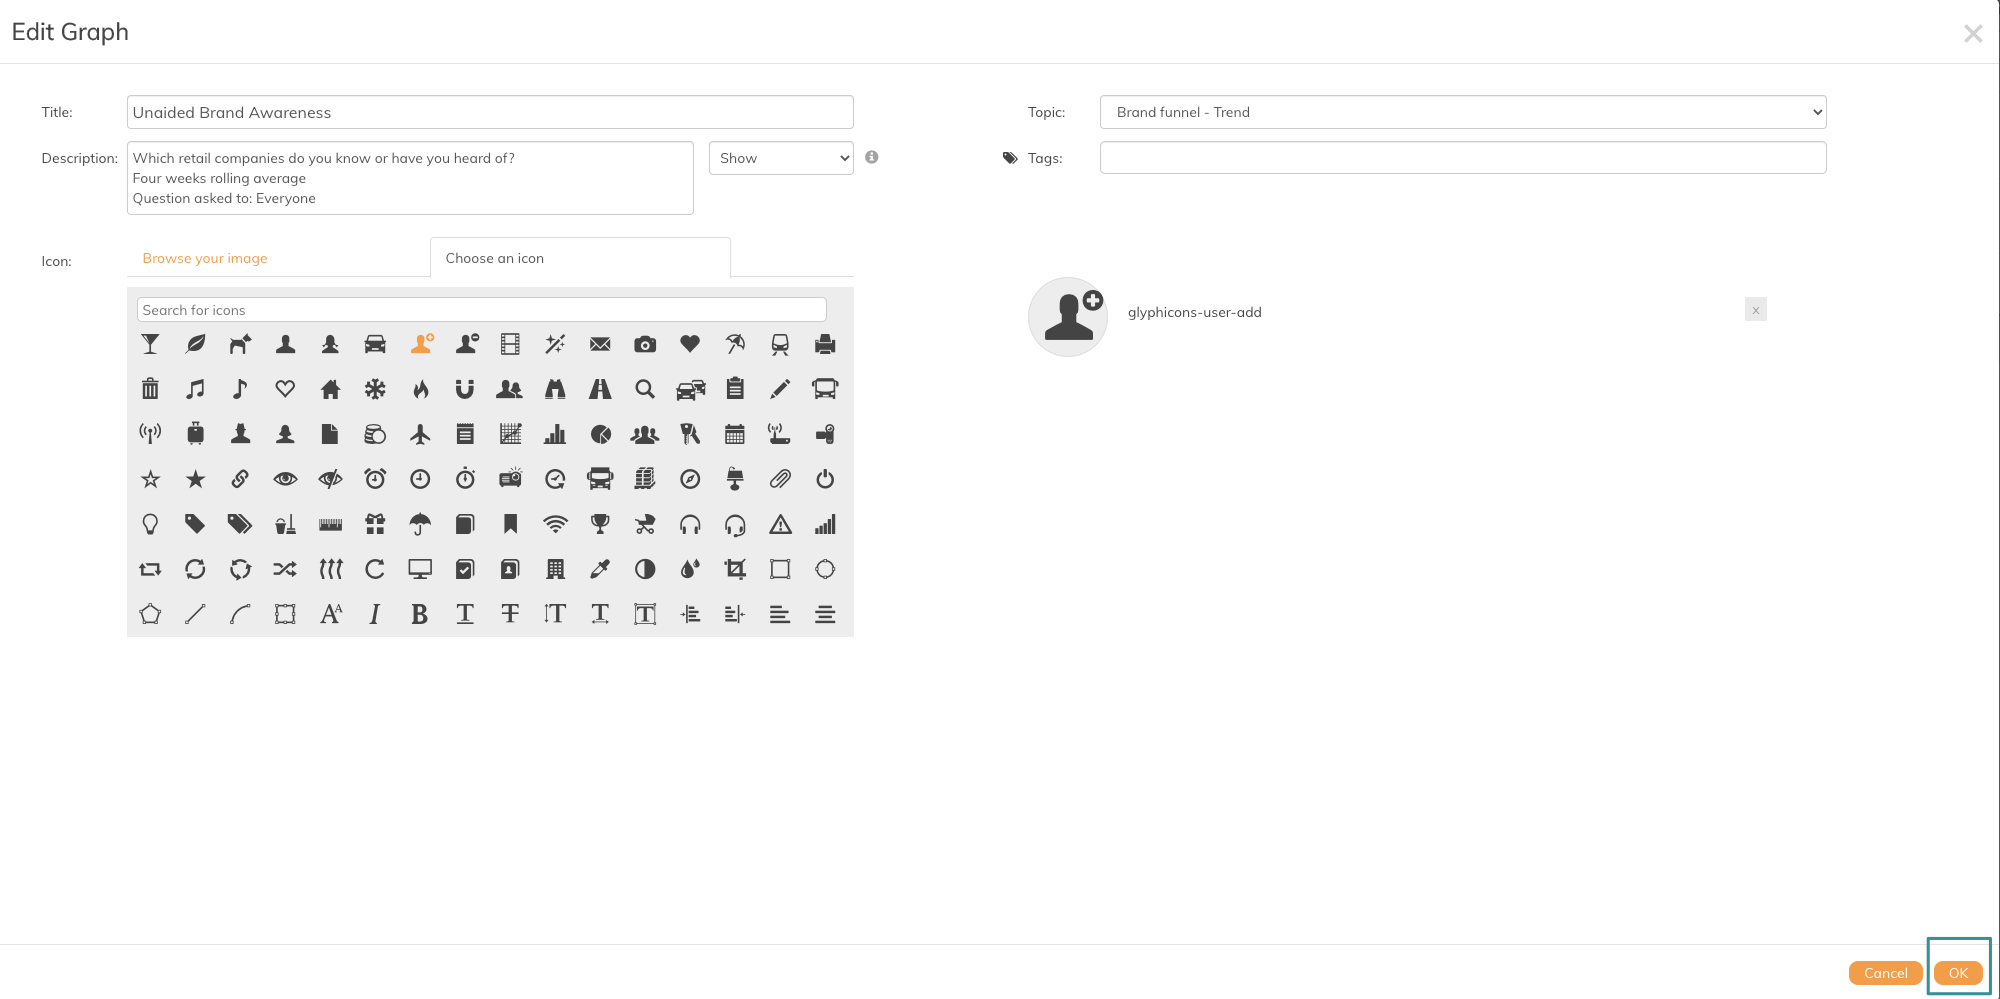
5. Click Ok
6. Click Save Changes
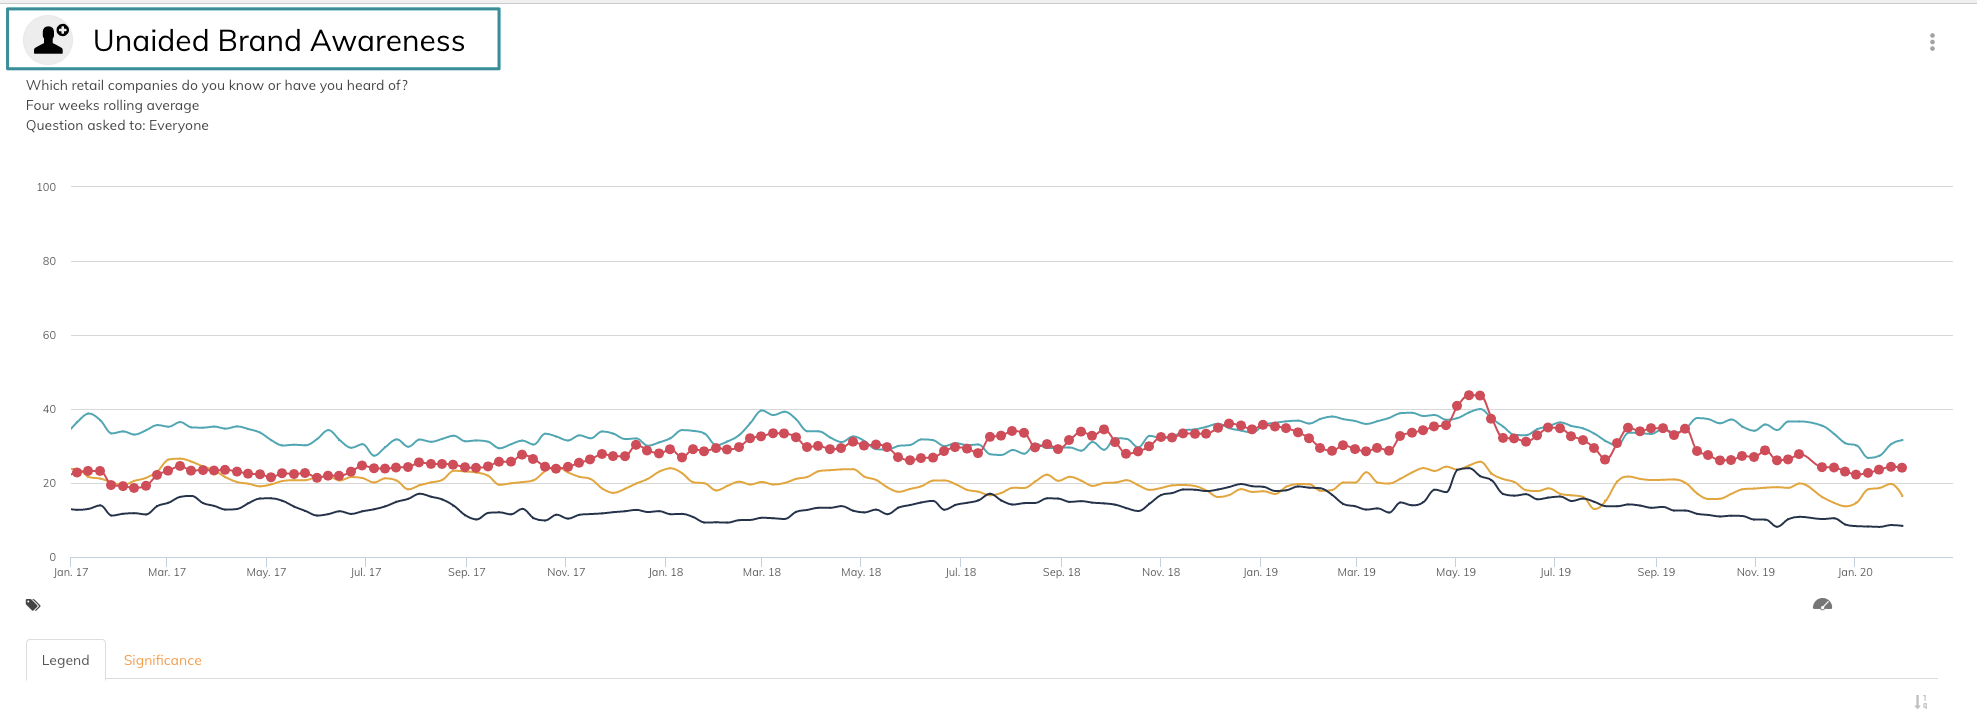
The icon is now added to your graph.
If you do not know which icon to use for different data series, you Google to search for icons to visualize data series.
If you want to add your own customised icon, use the image function. Read this article to find out how to use this.
If you have any questions, do not hesitate to contact us on support@penetrace
