Dashboards with images make it easier for users to recognize data series more quickly. This article shows you how to add images to make a more content-rich dashboard
Applies to Trend Monitor
The following must be in place in order to add images to a graph:
- Access to your dashboard
- Edit access rights
- An already created graph
Follow these steps to add an image to a graph:
1. Click Edit in a graph
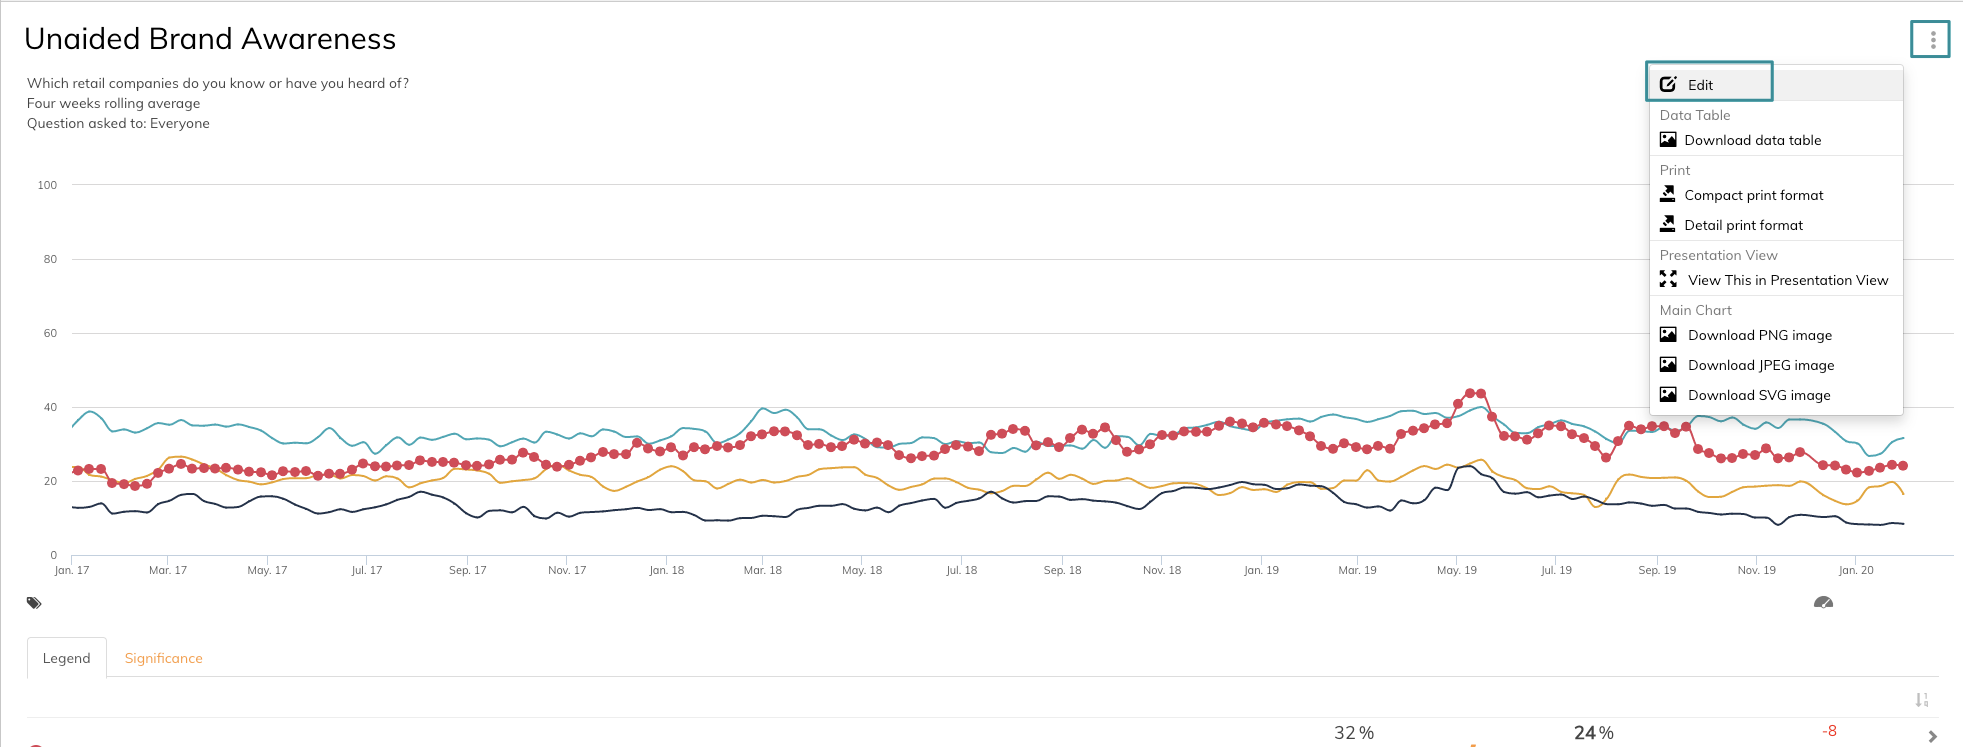
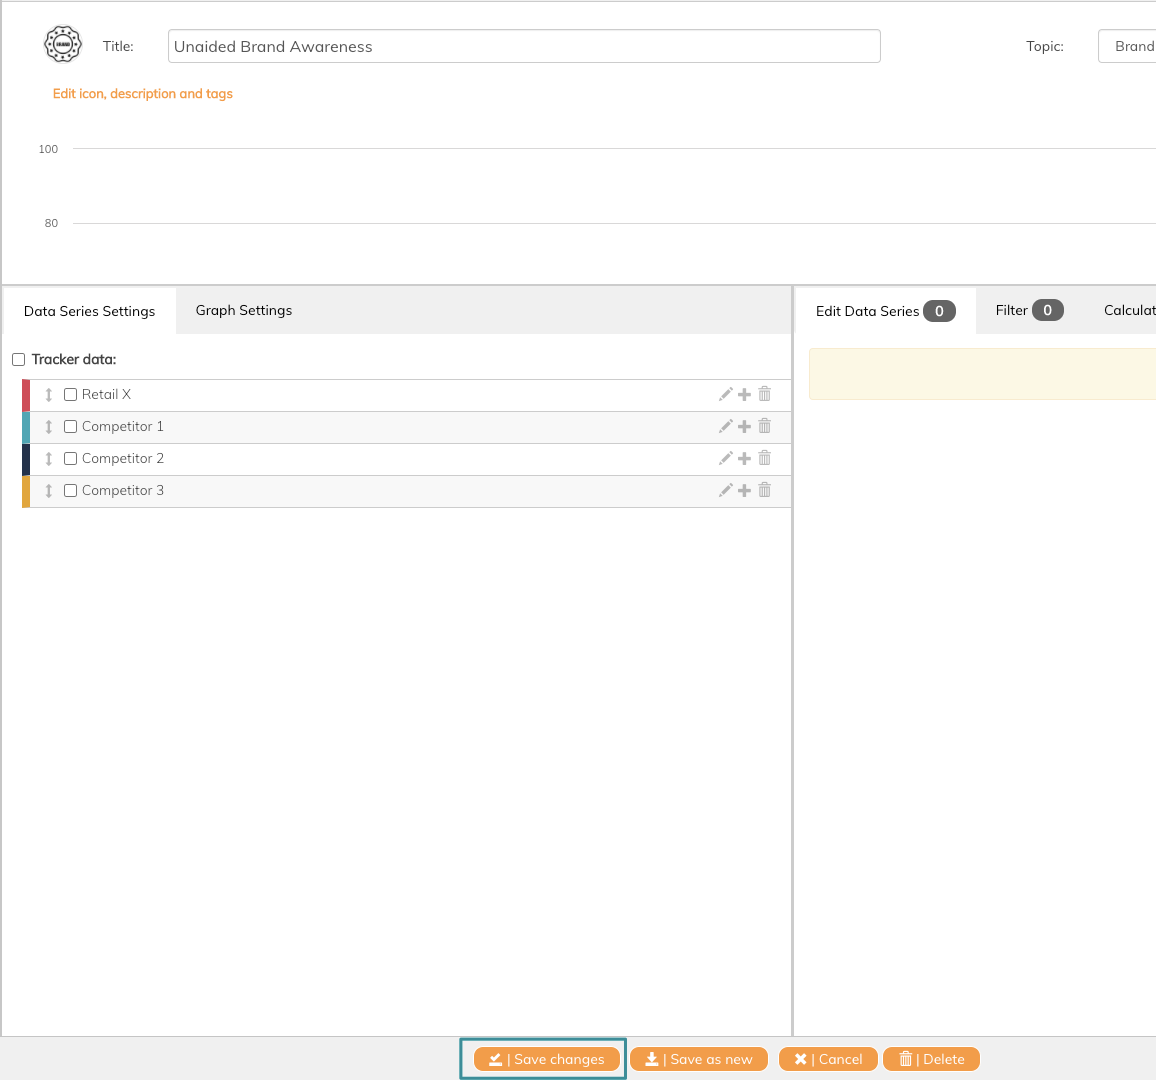
You now enter the edit mode of the graph.
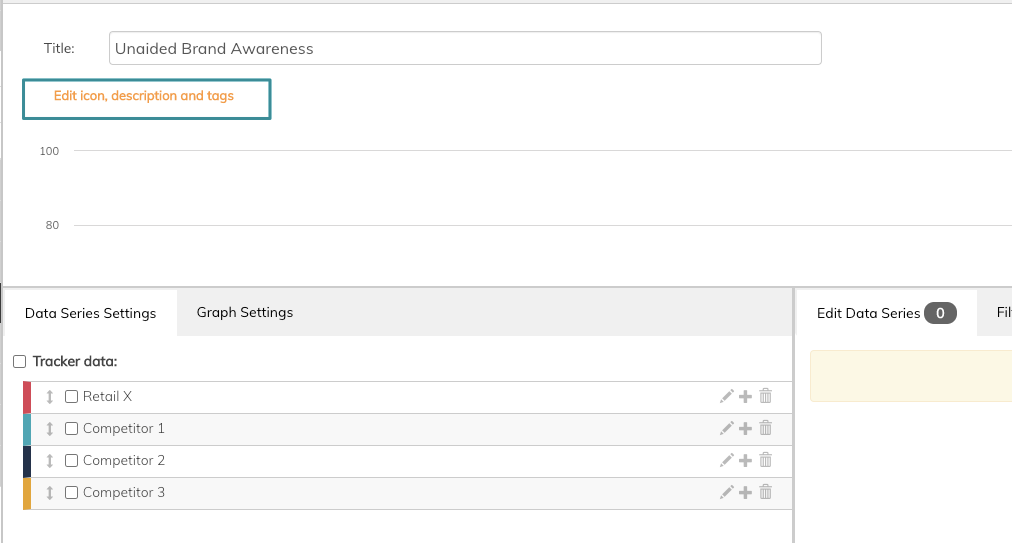
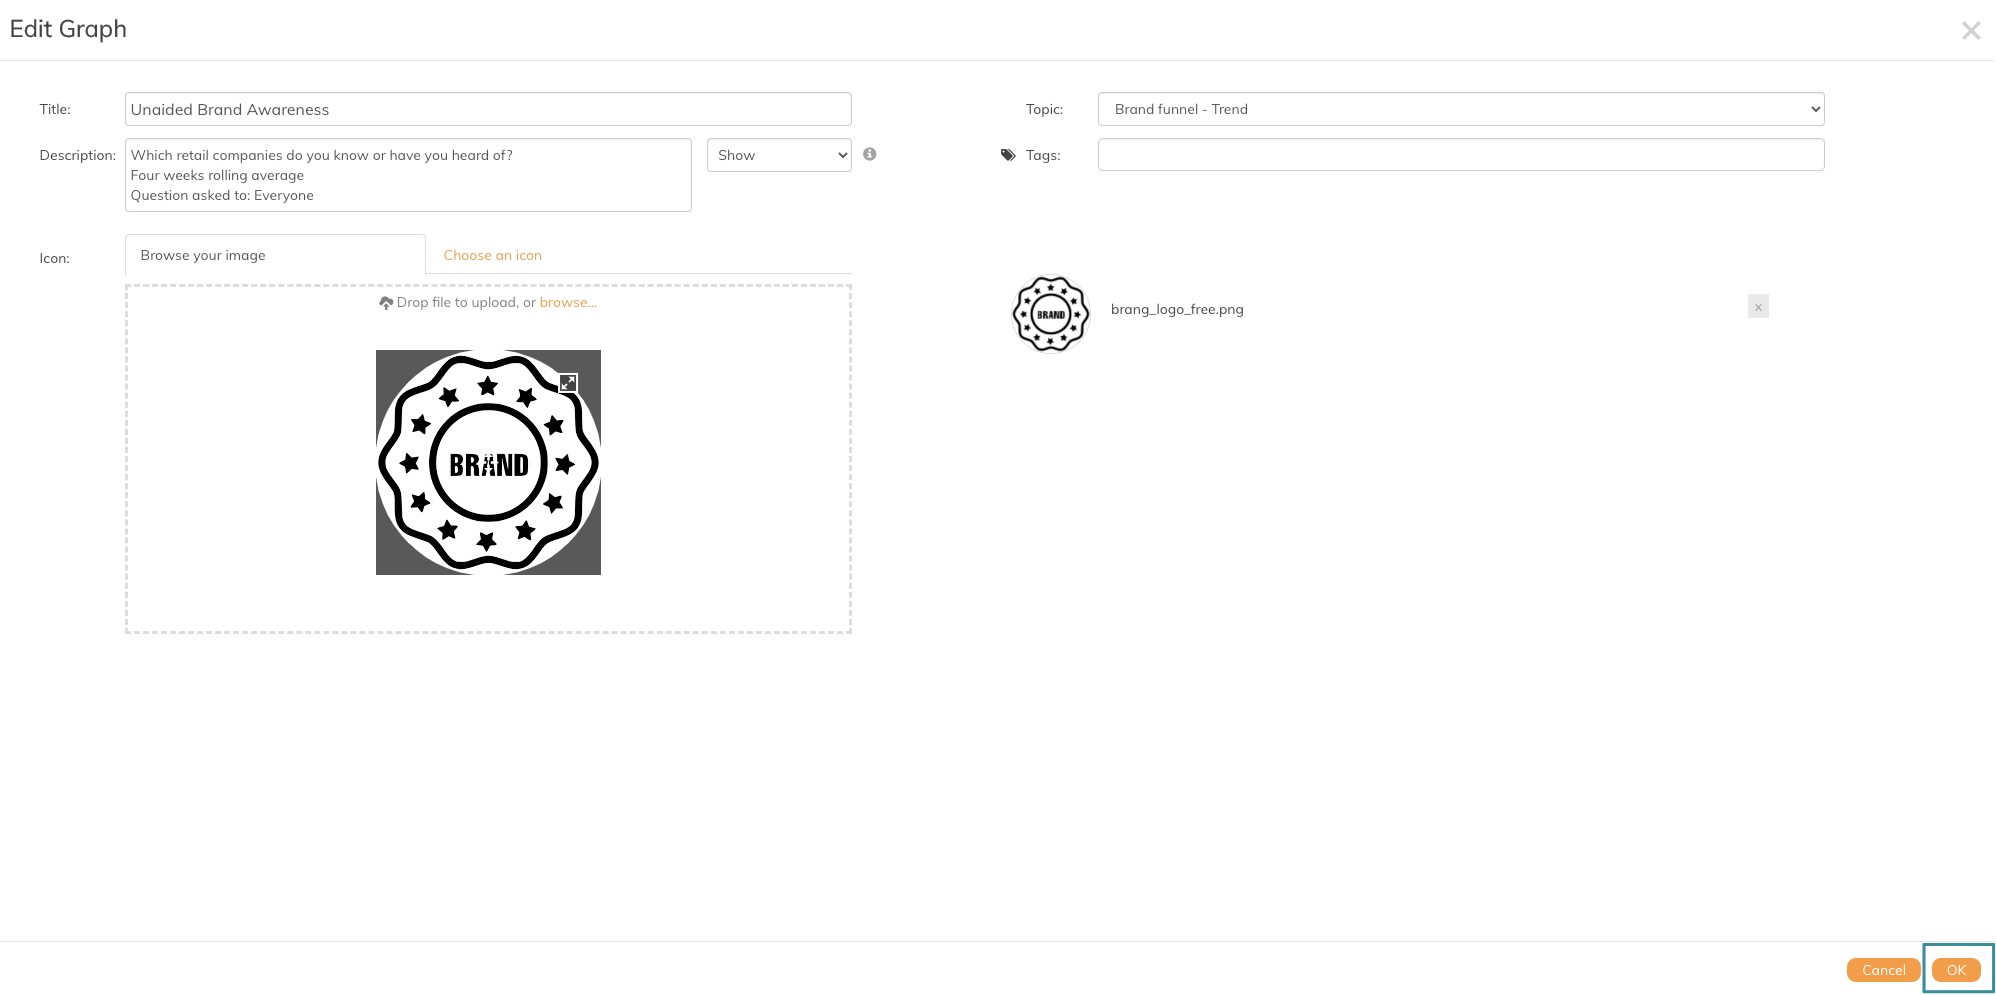
2. Click Edit icon, description and tags
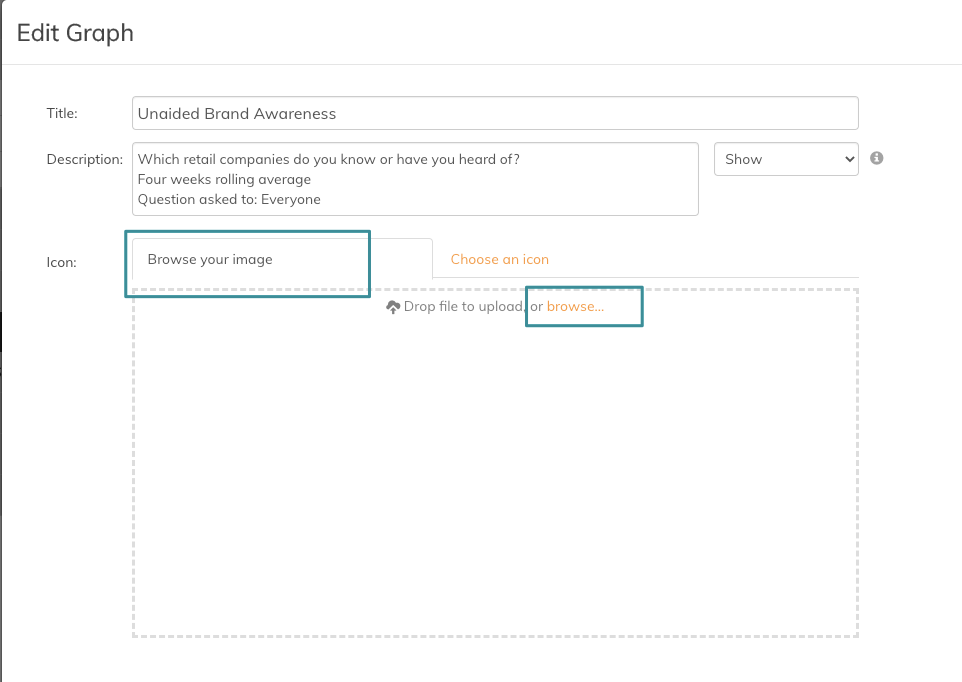
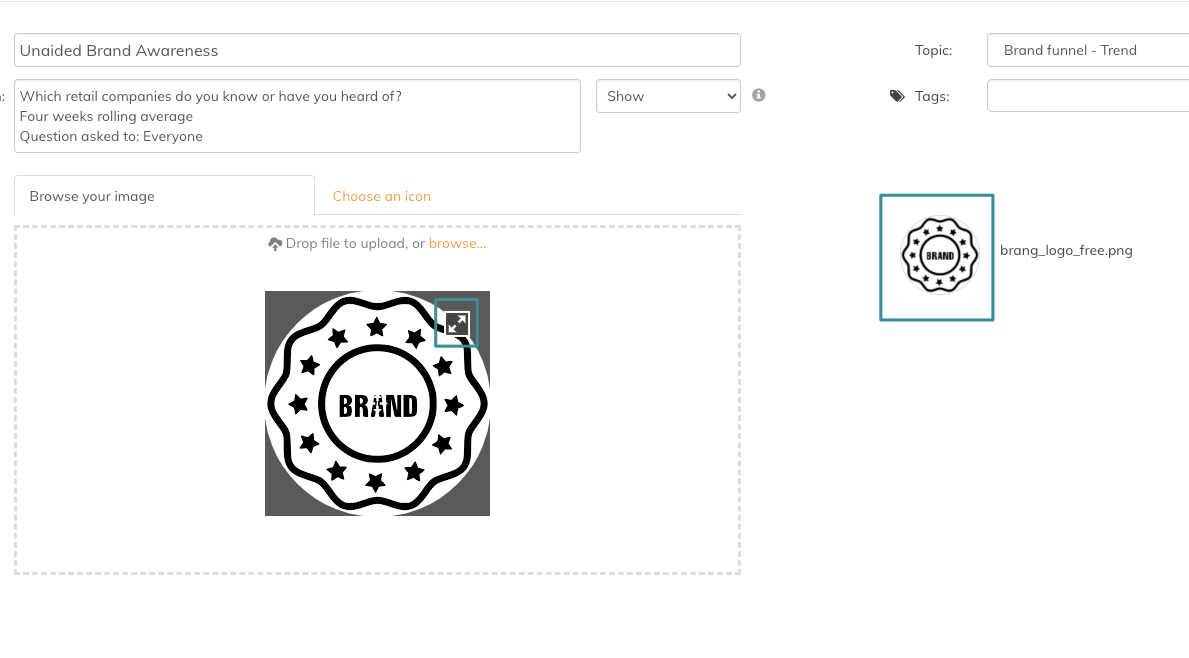
3. Drop your image here or click Browse to upload your image
In this example, we have added a brand logo.
4. Drag the arrows to adjust the image to the right visualisation
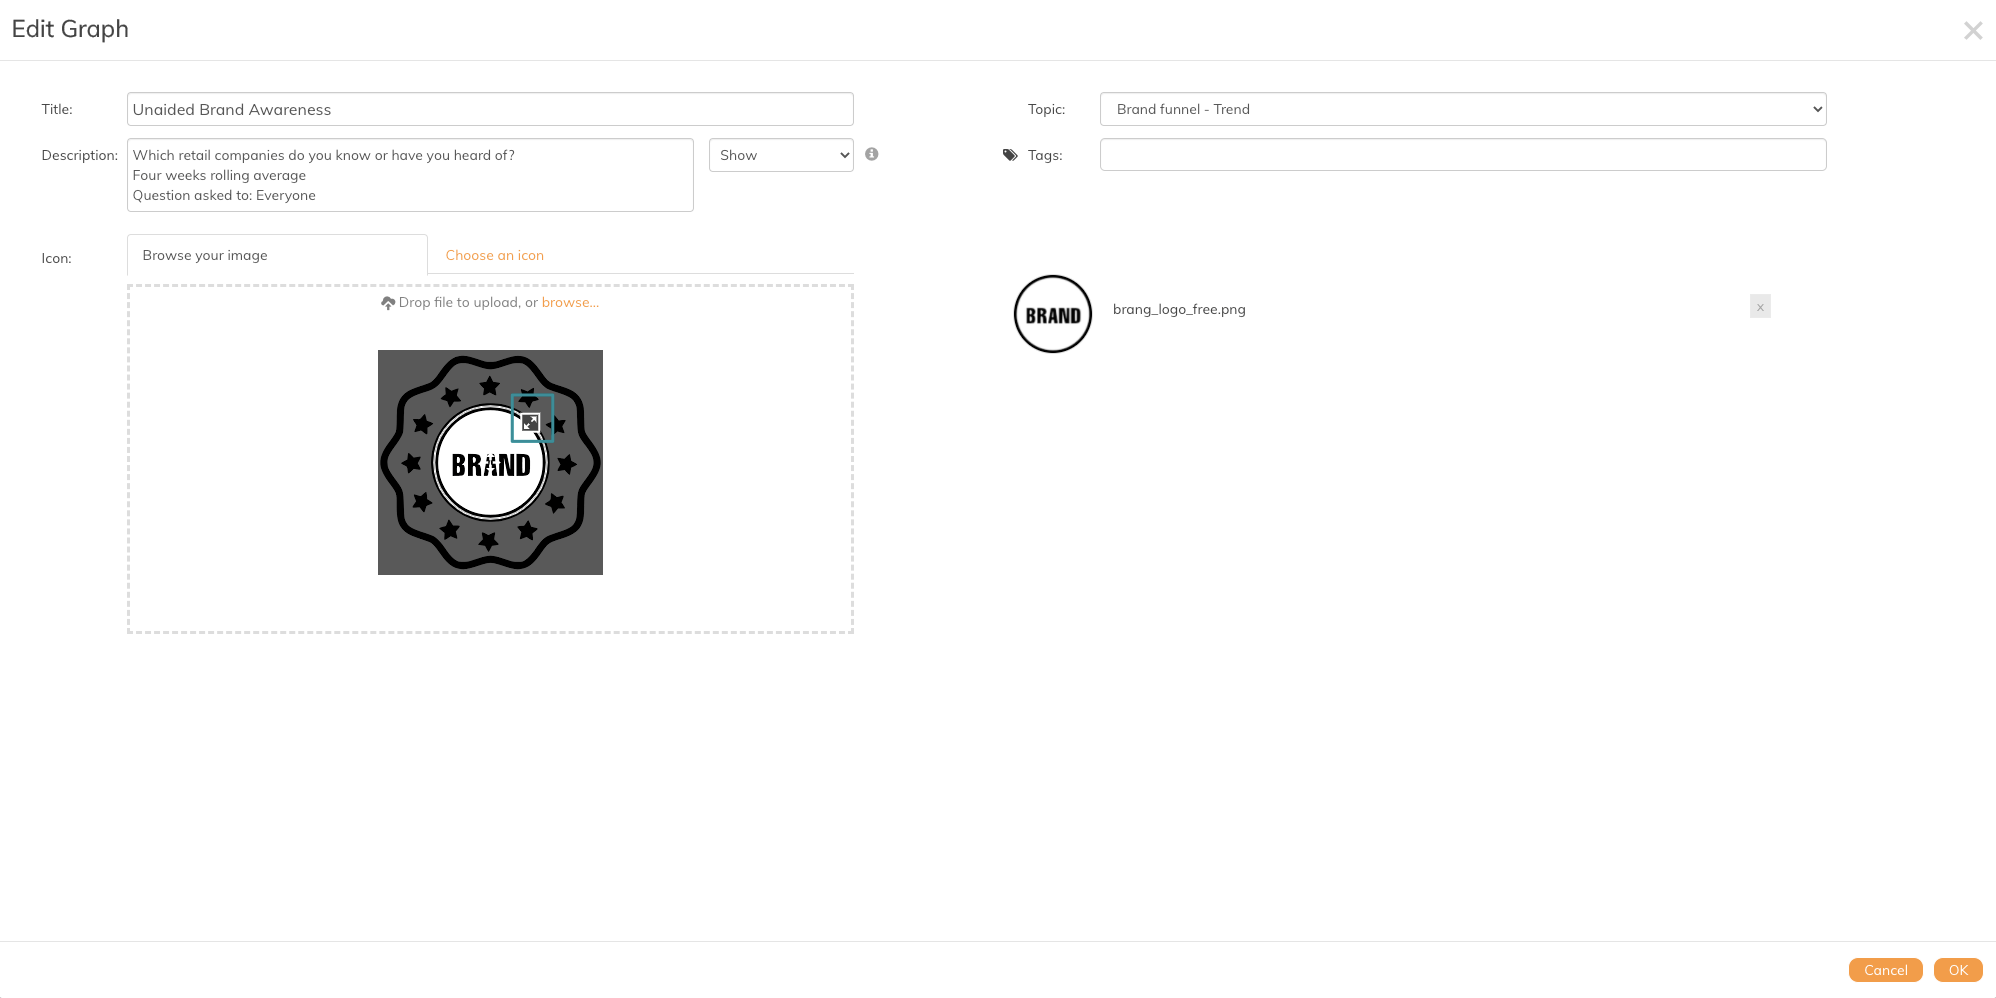
5. Click OK
6. Click Save Changes
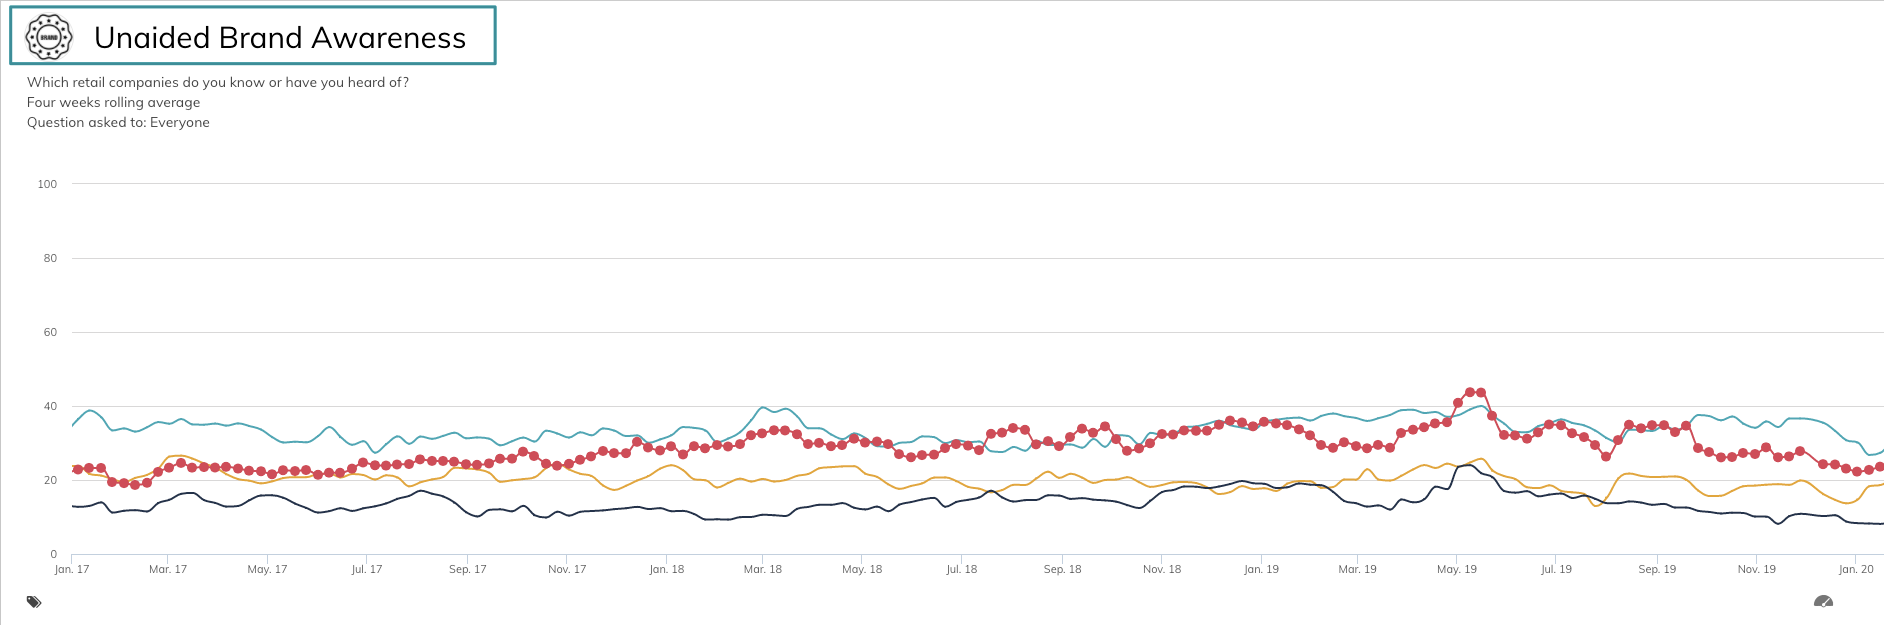
Now the image is visible in your graph.
If you want to add an icon to your graph instead, read this article.
If you have any questions, do not hesitate to contact us on support@penetrace