Applies to Trend Monitor
Calculated measures refer to a function that allows you to create new measures based on whatever data you have available. You can create new measures based on any data series. A calculated measure will be added to your current graph and will be saved in data sources for future use in other graphs. You can combine data from any data source and the calculation is updated every time the underlying data source(s) is updated. You can specify formula with both data series and numbers, and you can group data series and numbers.
In order to create a calculated measure, the following must be in place:
- Access to your dashboard
- Editor or admin access rights to your dashboard
- Graph with the data series that are necessary for the calculation
- The formula for the calculation
Follow these steps to create a calculated measure:
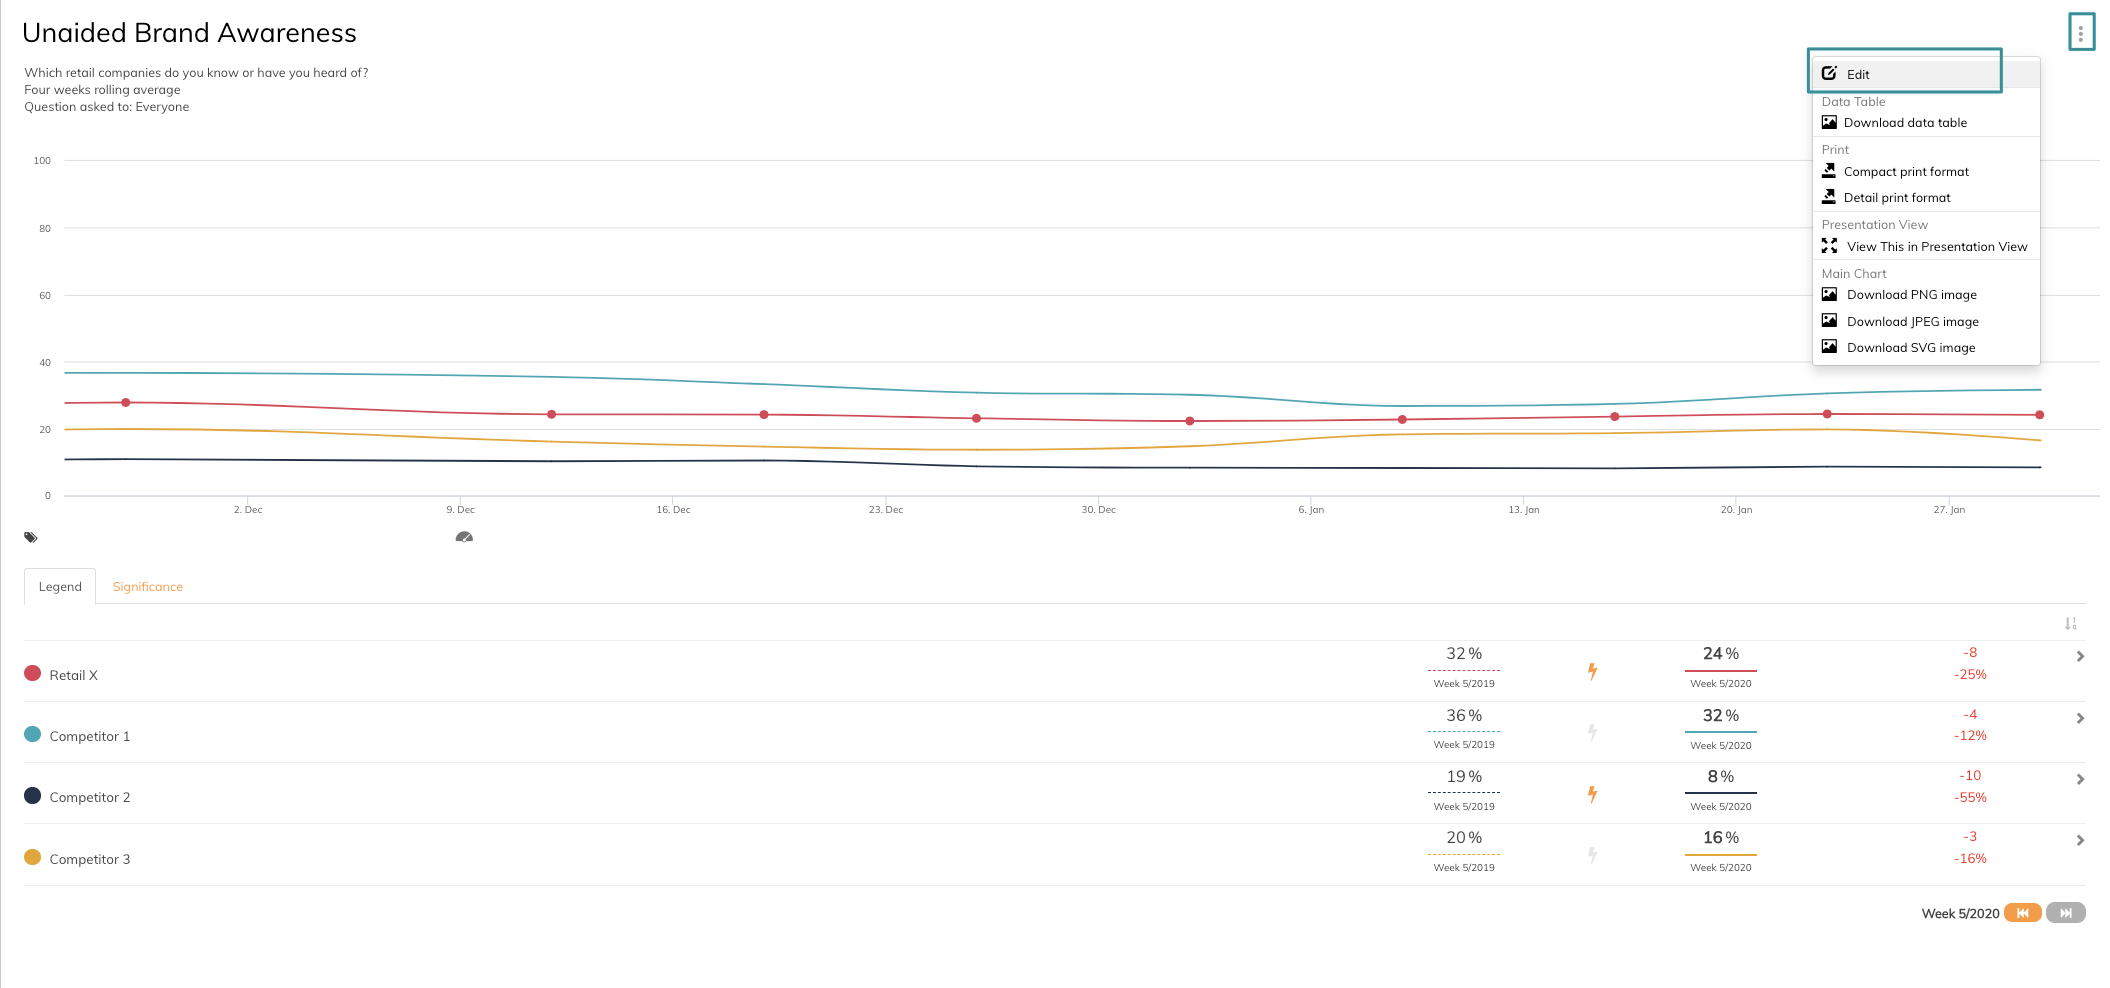
1. Click Edit to a graph
In this example, we are going to make a calculated measure of the unaided brand awareness to visualize the average unaided brand awareness of the brands/competitors added in this graph. The formula for this calculation will be (Unaided brand awareness, Retail X + Unaided brand awareness, Competitor 1 + Unaided brand awareness, Competitor 2 + Unaided brand awareness, Competitor 3)/4
2. Click Calculation
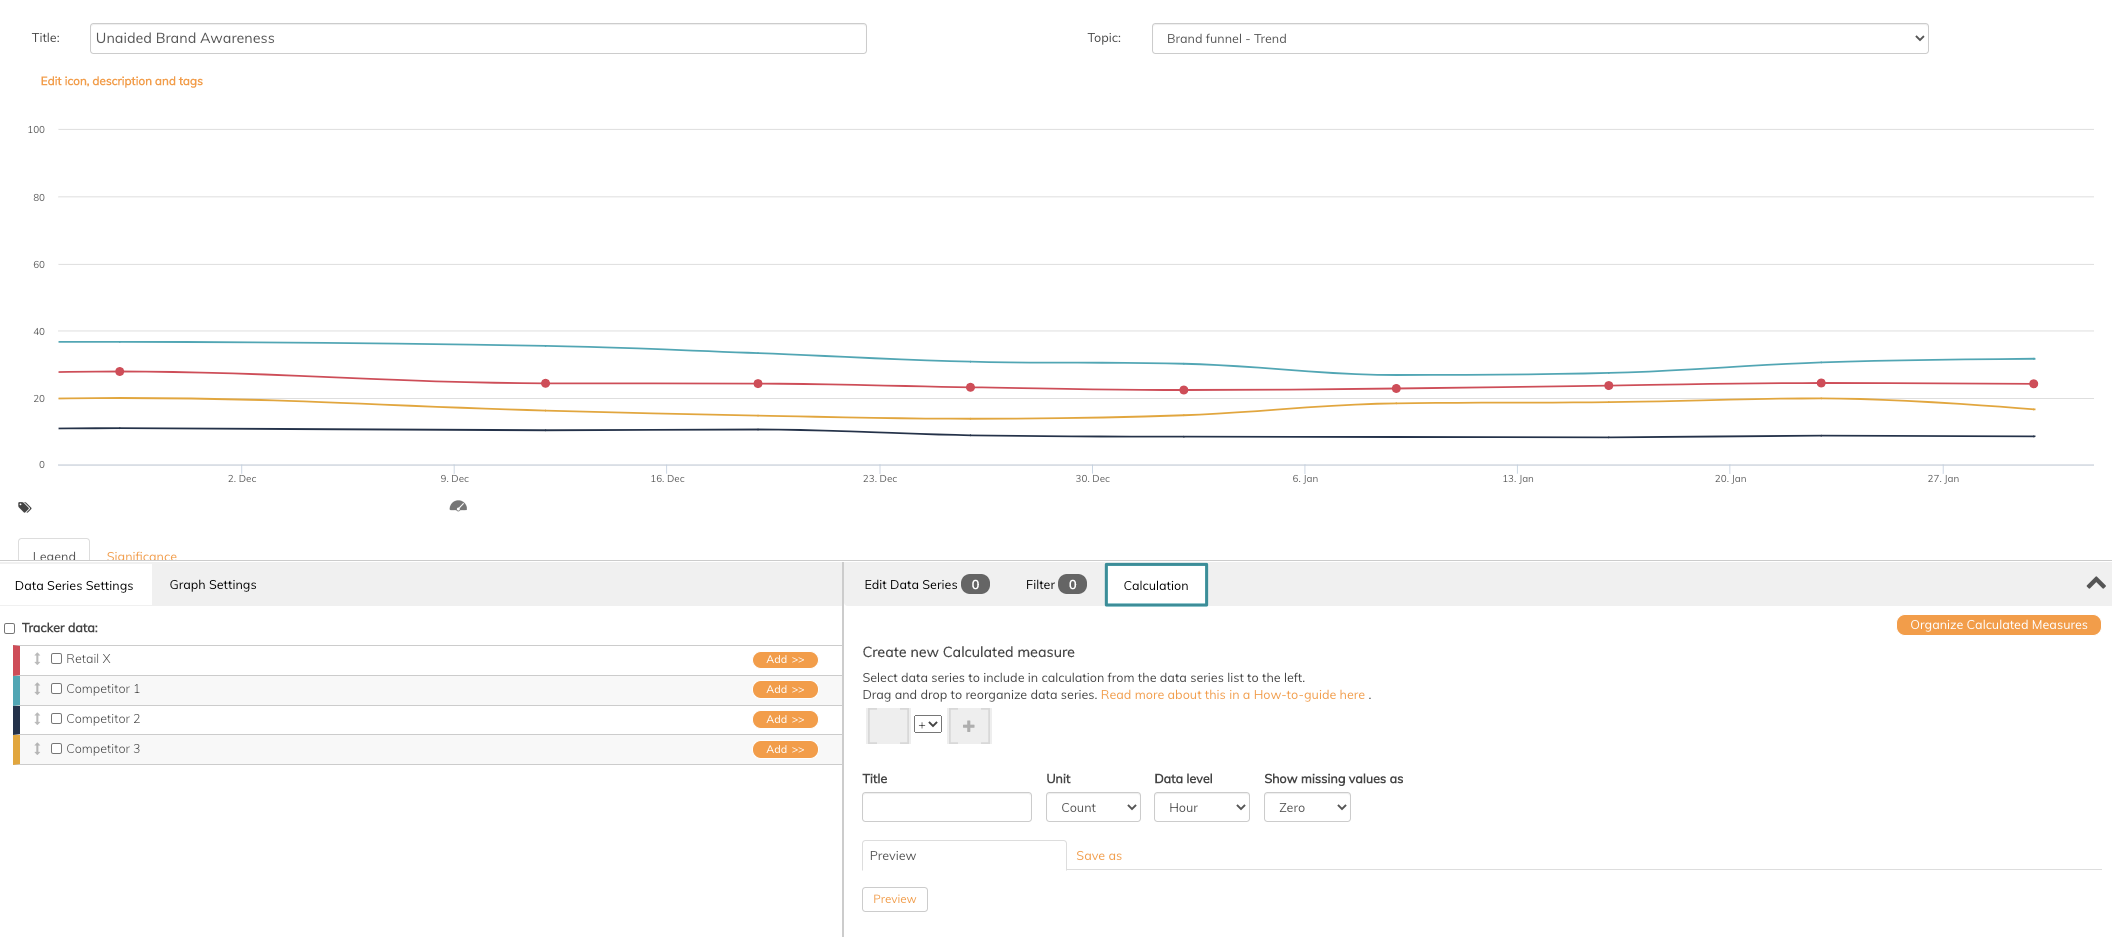
You are now in the edit area for setting up your own calculations.
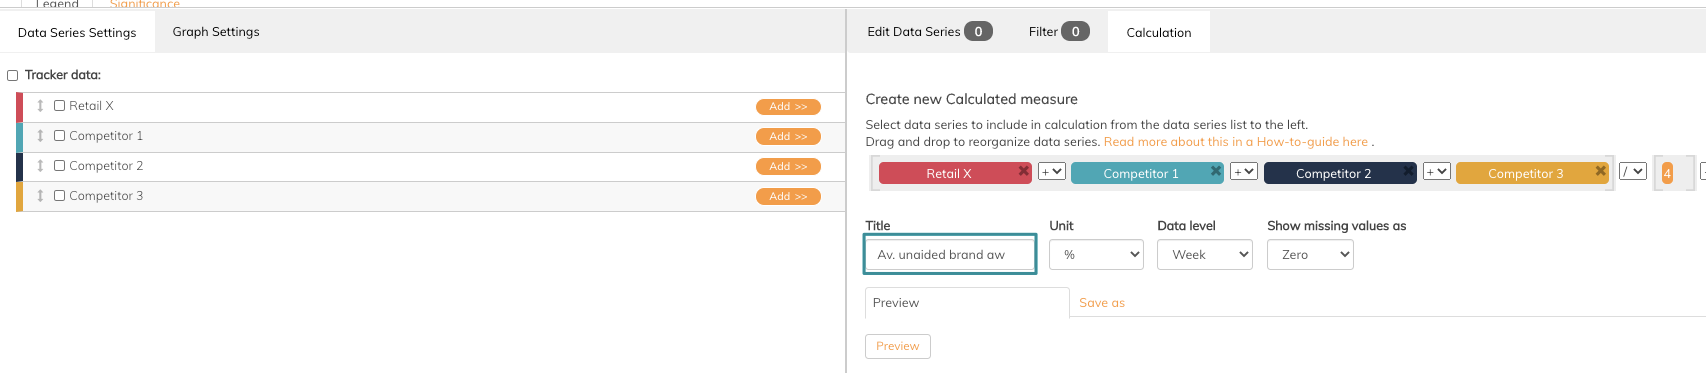
3. Give the calculation a title that will be the name of the data series
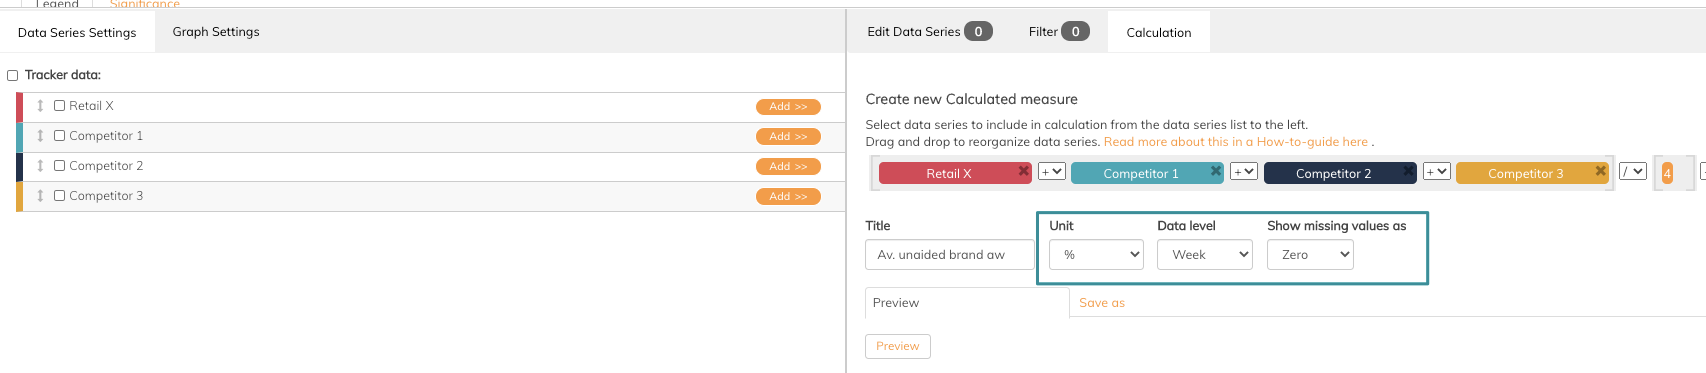
4. Specify unit, data aggregation level and how you want missing values to be shown like
5. Drag and drop the data series from the left side into the formula area on the right side.
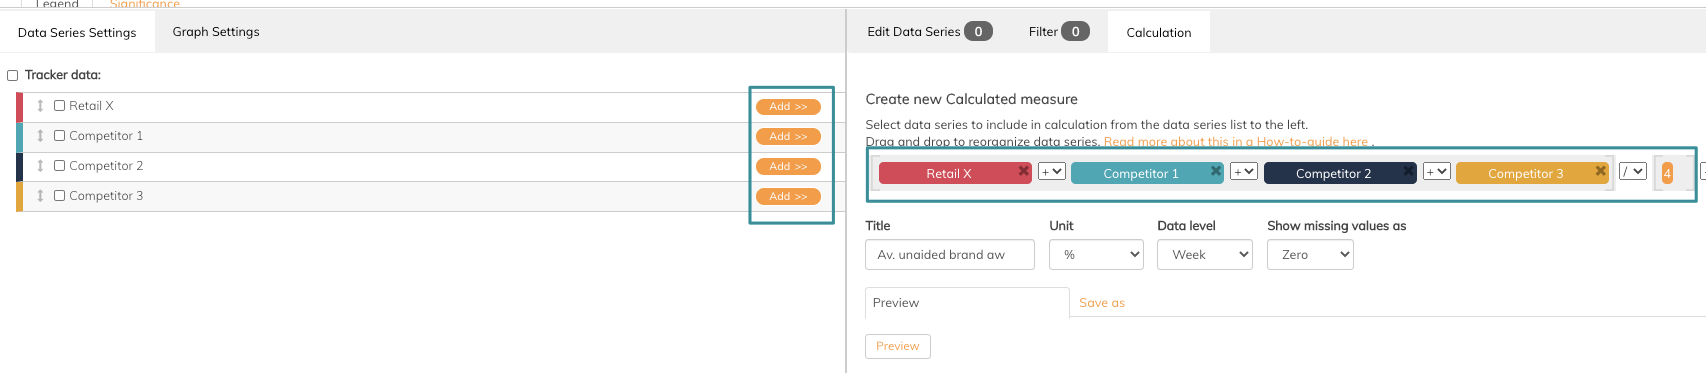
Make sure the formula have the correct setup.
6. Click the Preview button to see the data series in the chart
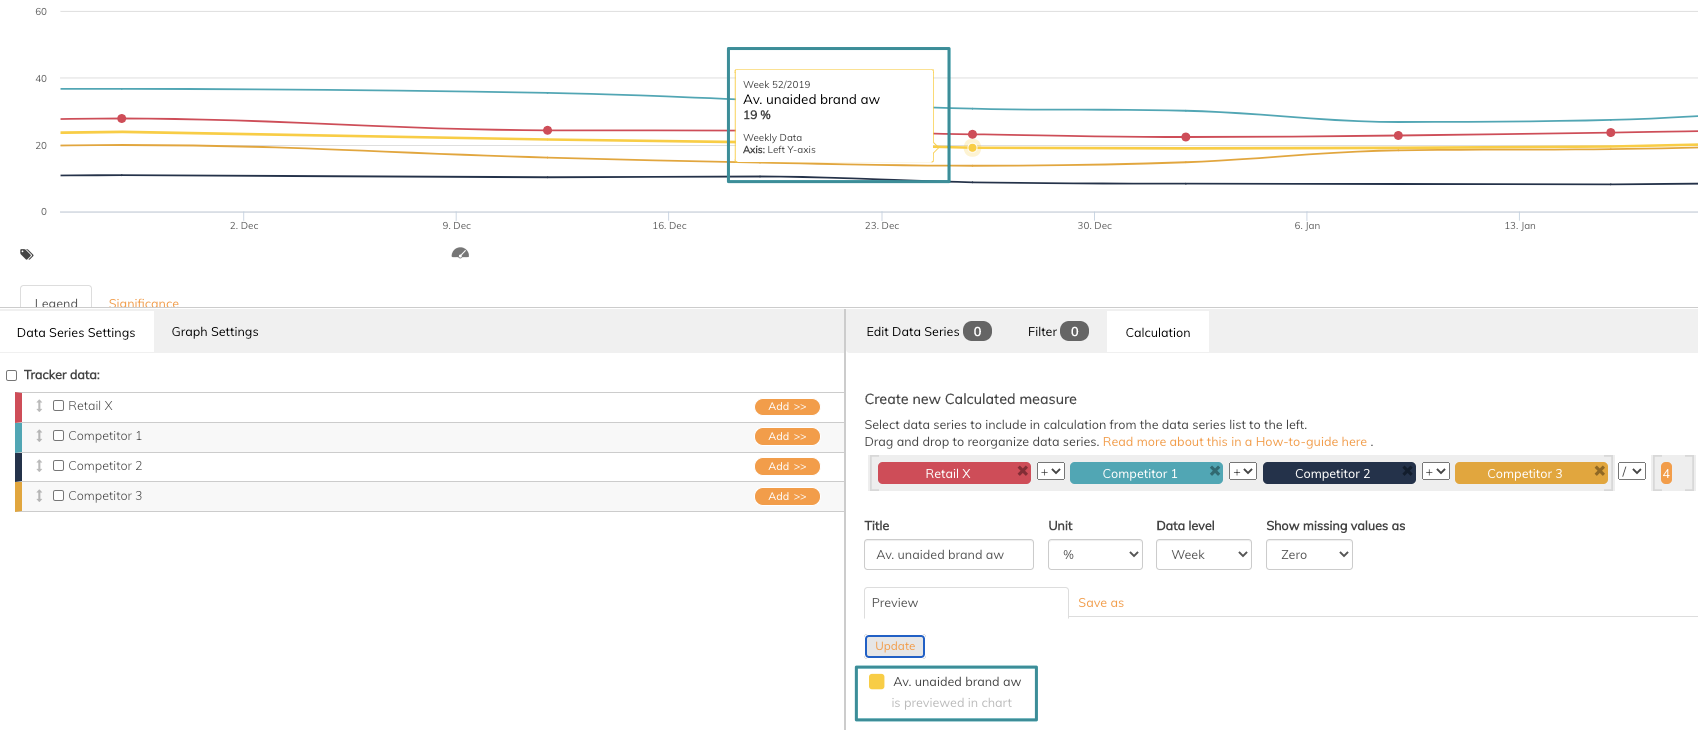
7. Click Save in the Save as phane
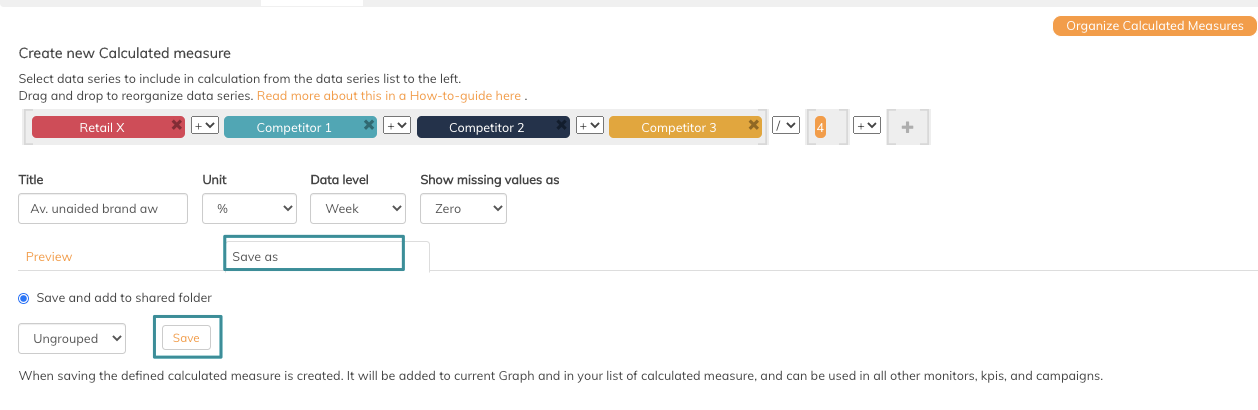
The calculation will now be saved as a new data series in the current graph, and also added in the Data Source area under Calculated Measure folder - so you can use the same calculation in other graphs. Read this article if you want to make your own folder structure.
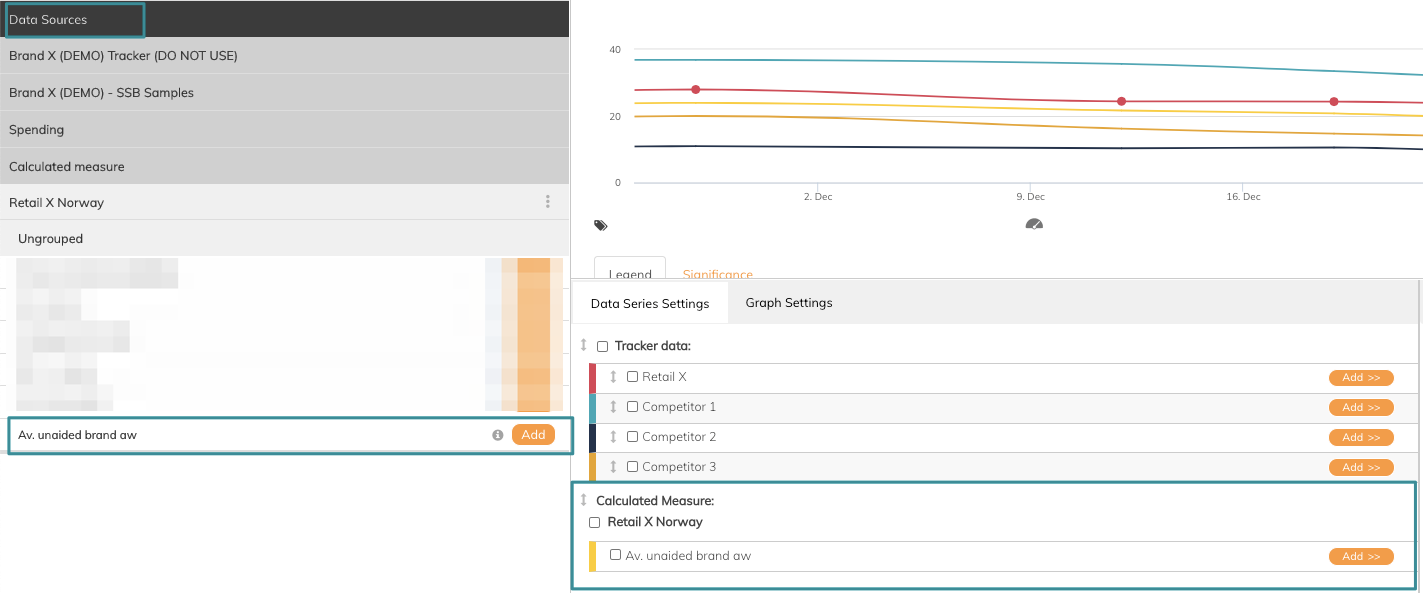
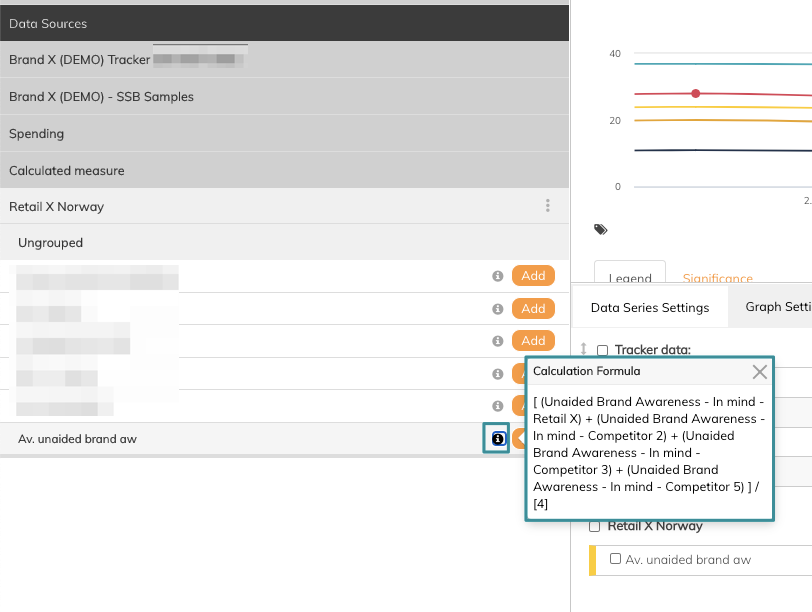
Be aware that it is not possible to edit the formula after saving it. But you can always inspect the formula by clicking the information icon to the right in Data Sources folder.
If you have any questions, do not hesitate to contact us on support@penetrace.com