If you want to make your own folder structure for your calculated measures in Data Sources area, read this article.
Applies to Trend Monitor
Calculated measures refer to a function that allows you to create your own calculations from data sources added to your dashboard. Read this article to learn how to create calculated measures.
To be able to organize calculated measures, the following must be in place:
- Access to your dashboard
- Editor or admin access rights
- Already created calculated measures
When you create a calculated measure, it is saved by default in an ungrouped folder in your Data Sources area. If you want to organize your calculated measures in custom folders, follow these steps:
1. Click Edit in any graph in your dashboard
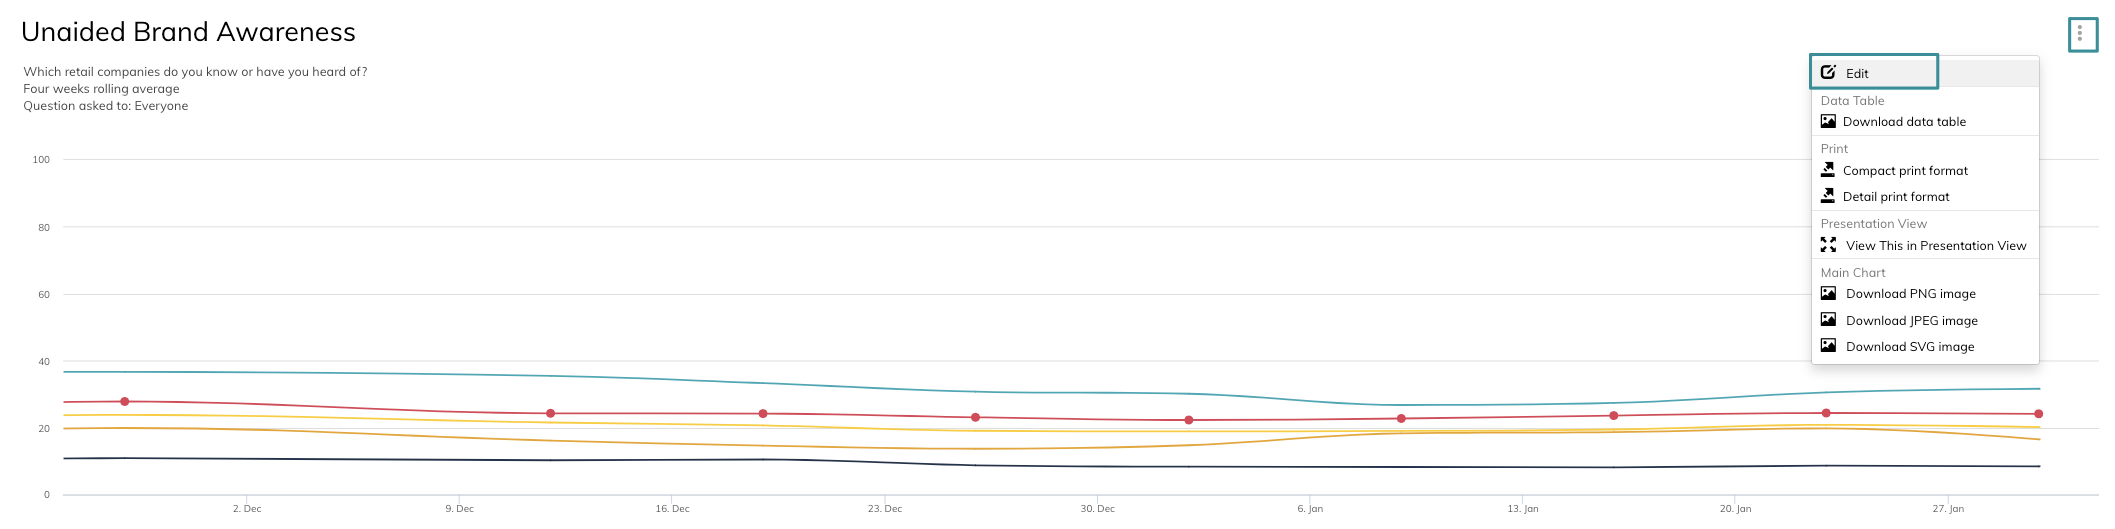
You are now in edit mode area.
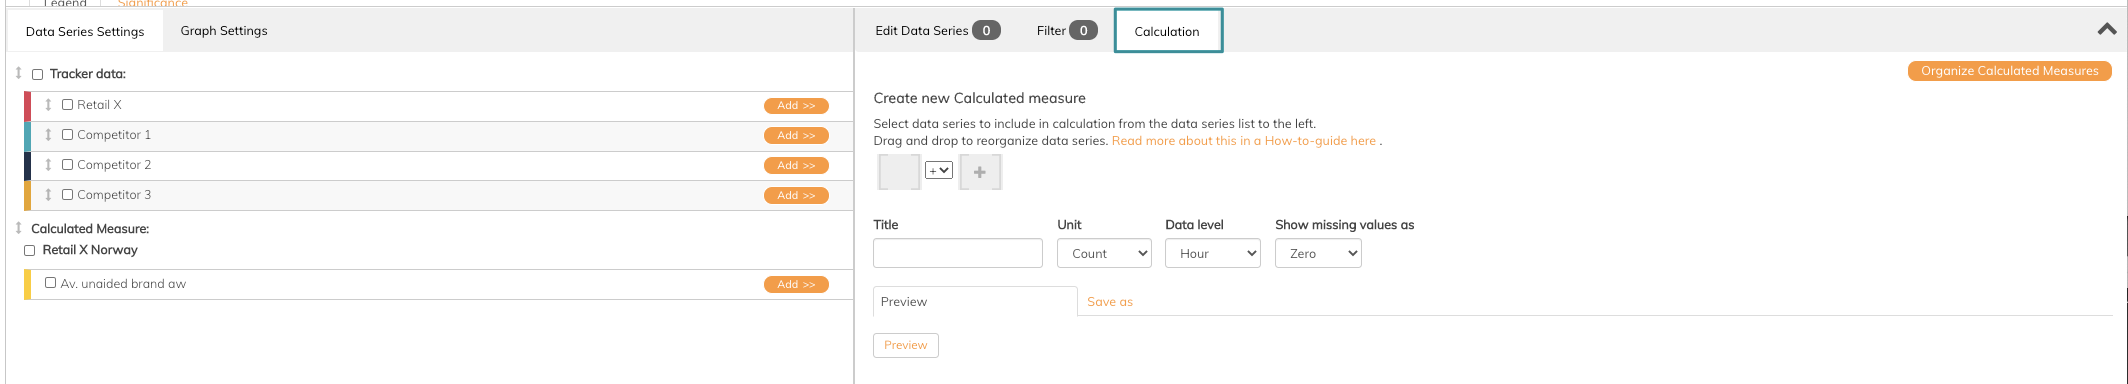
2. Click Calculation to the right
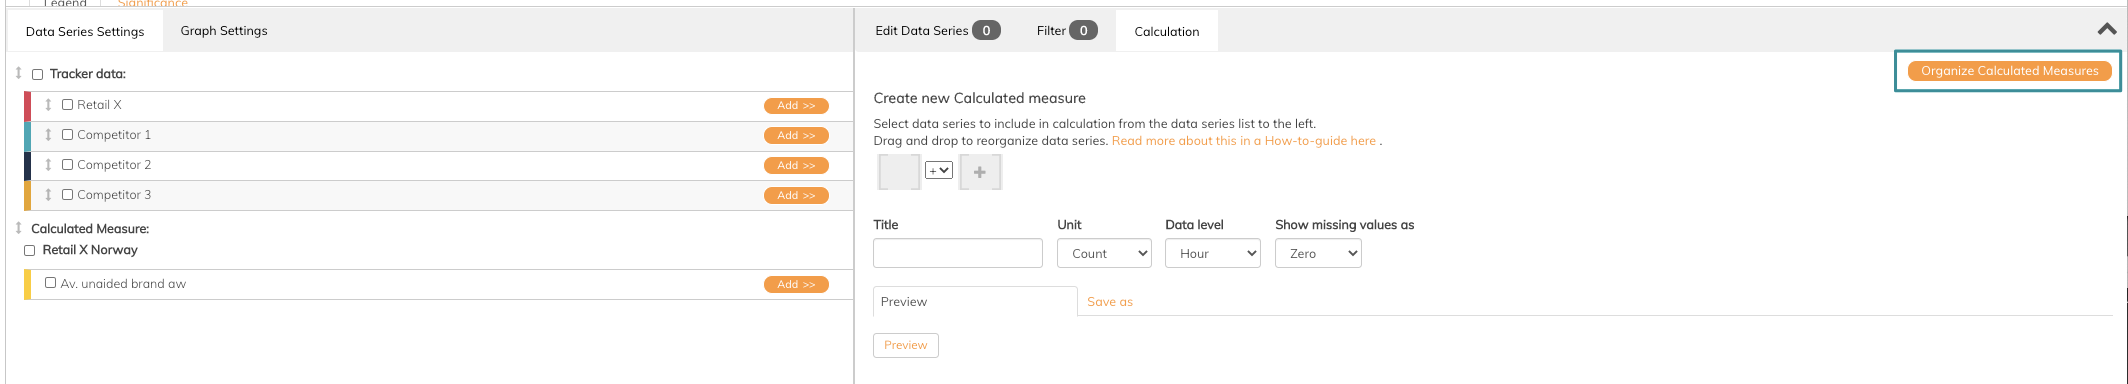
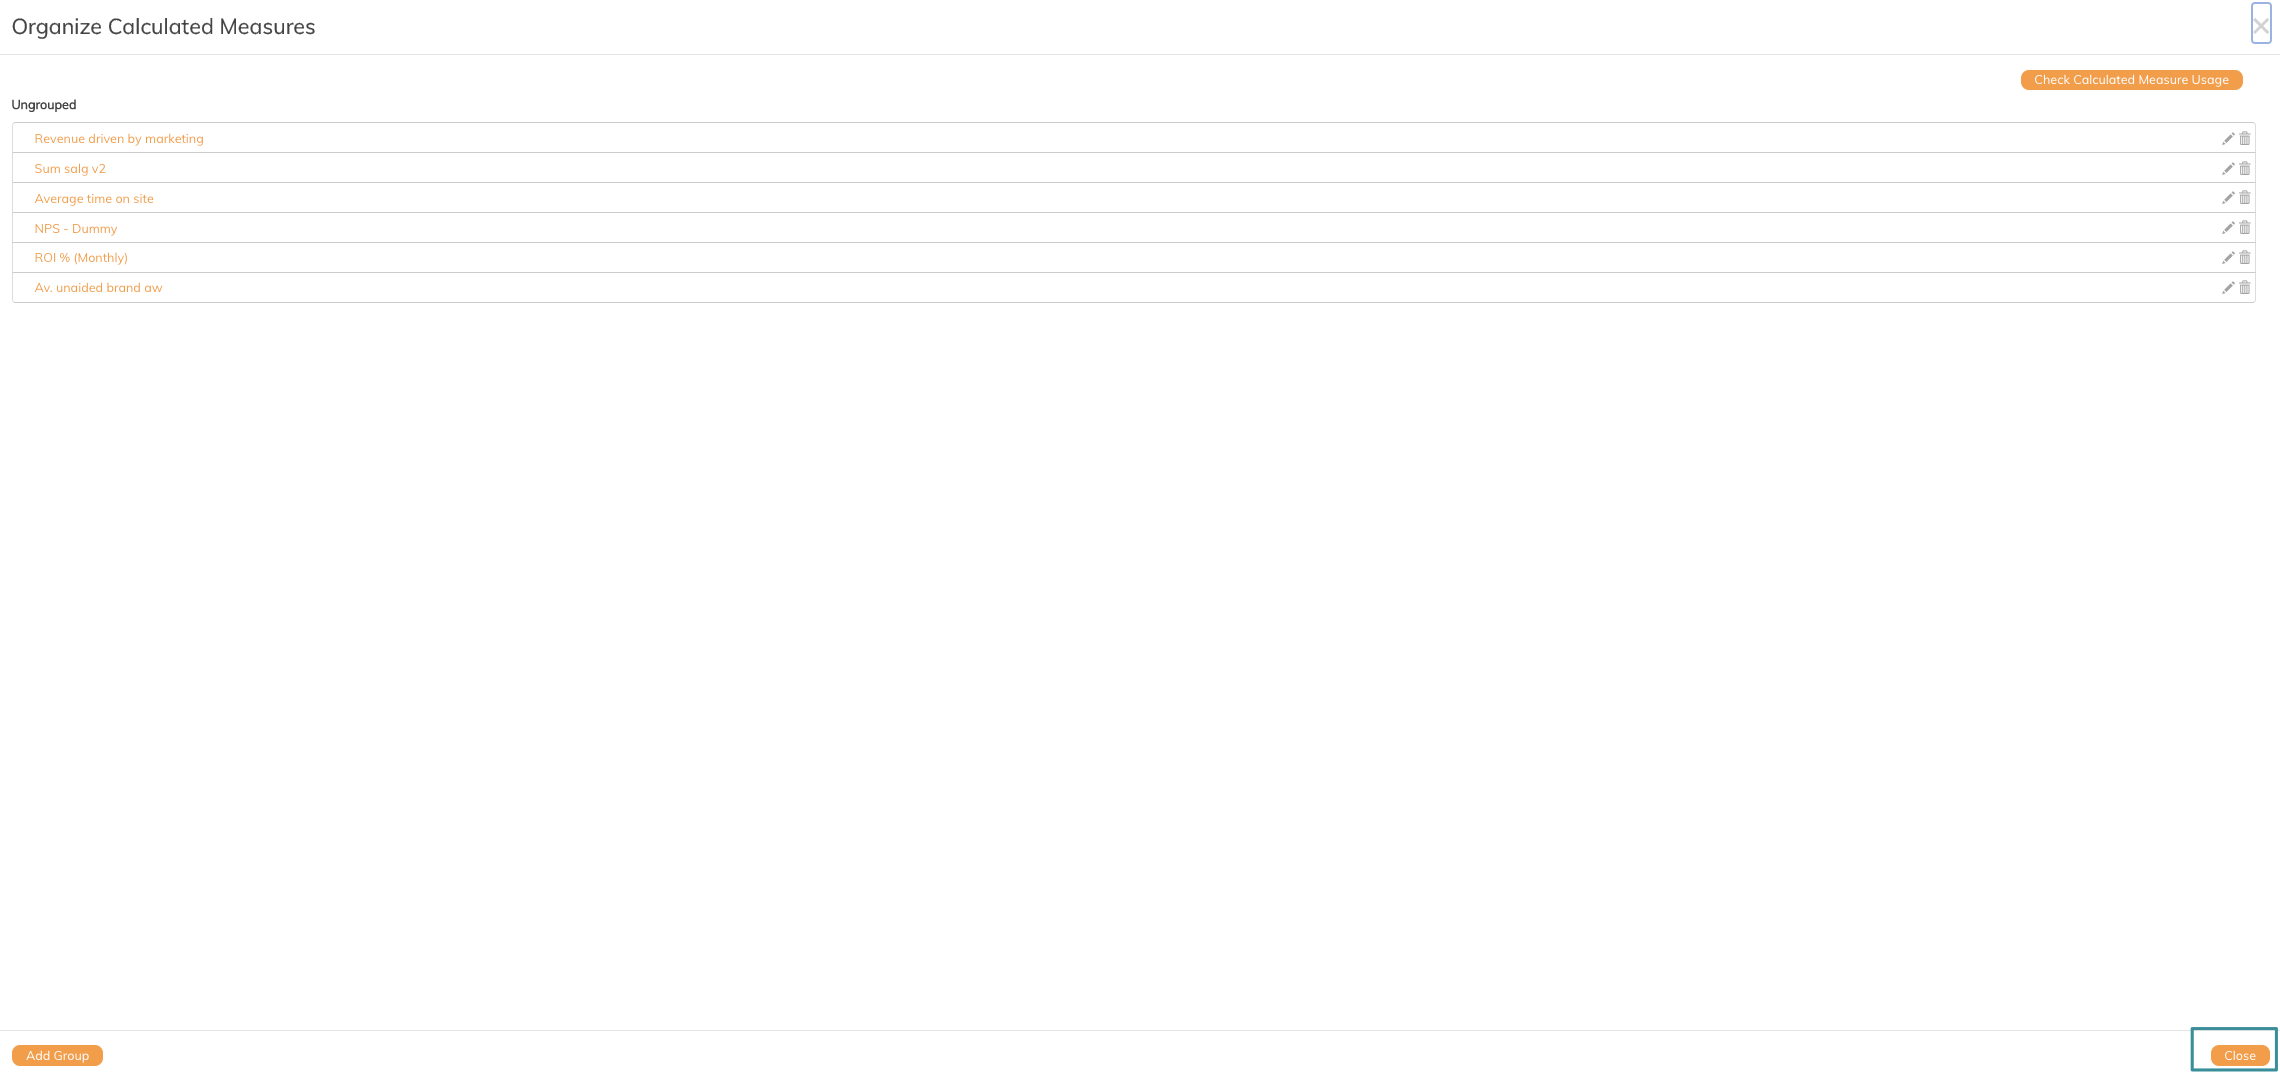
3. Click Organize Calculated Measures
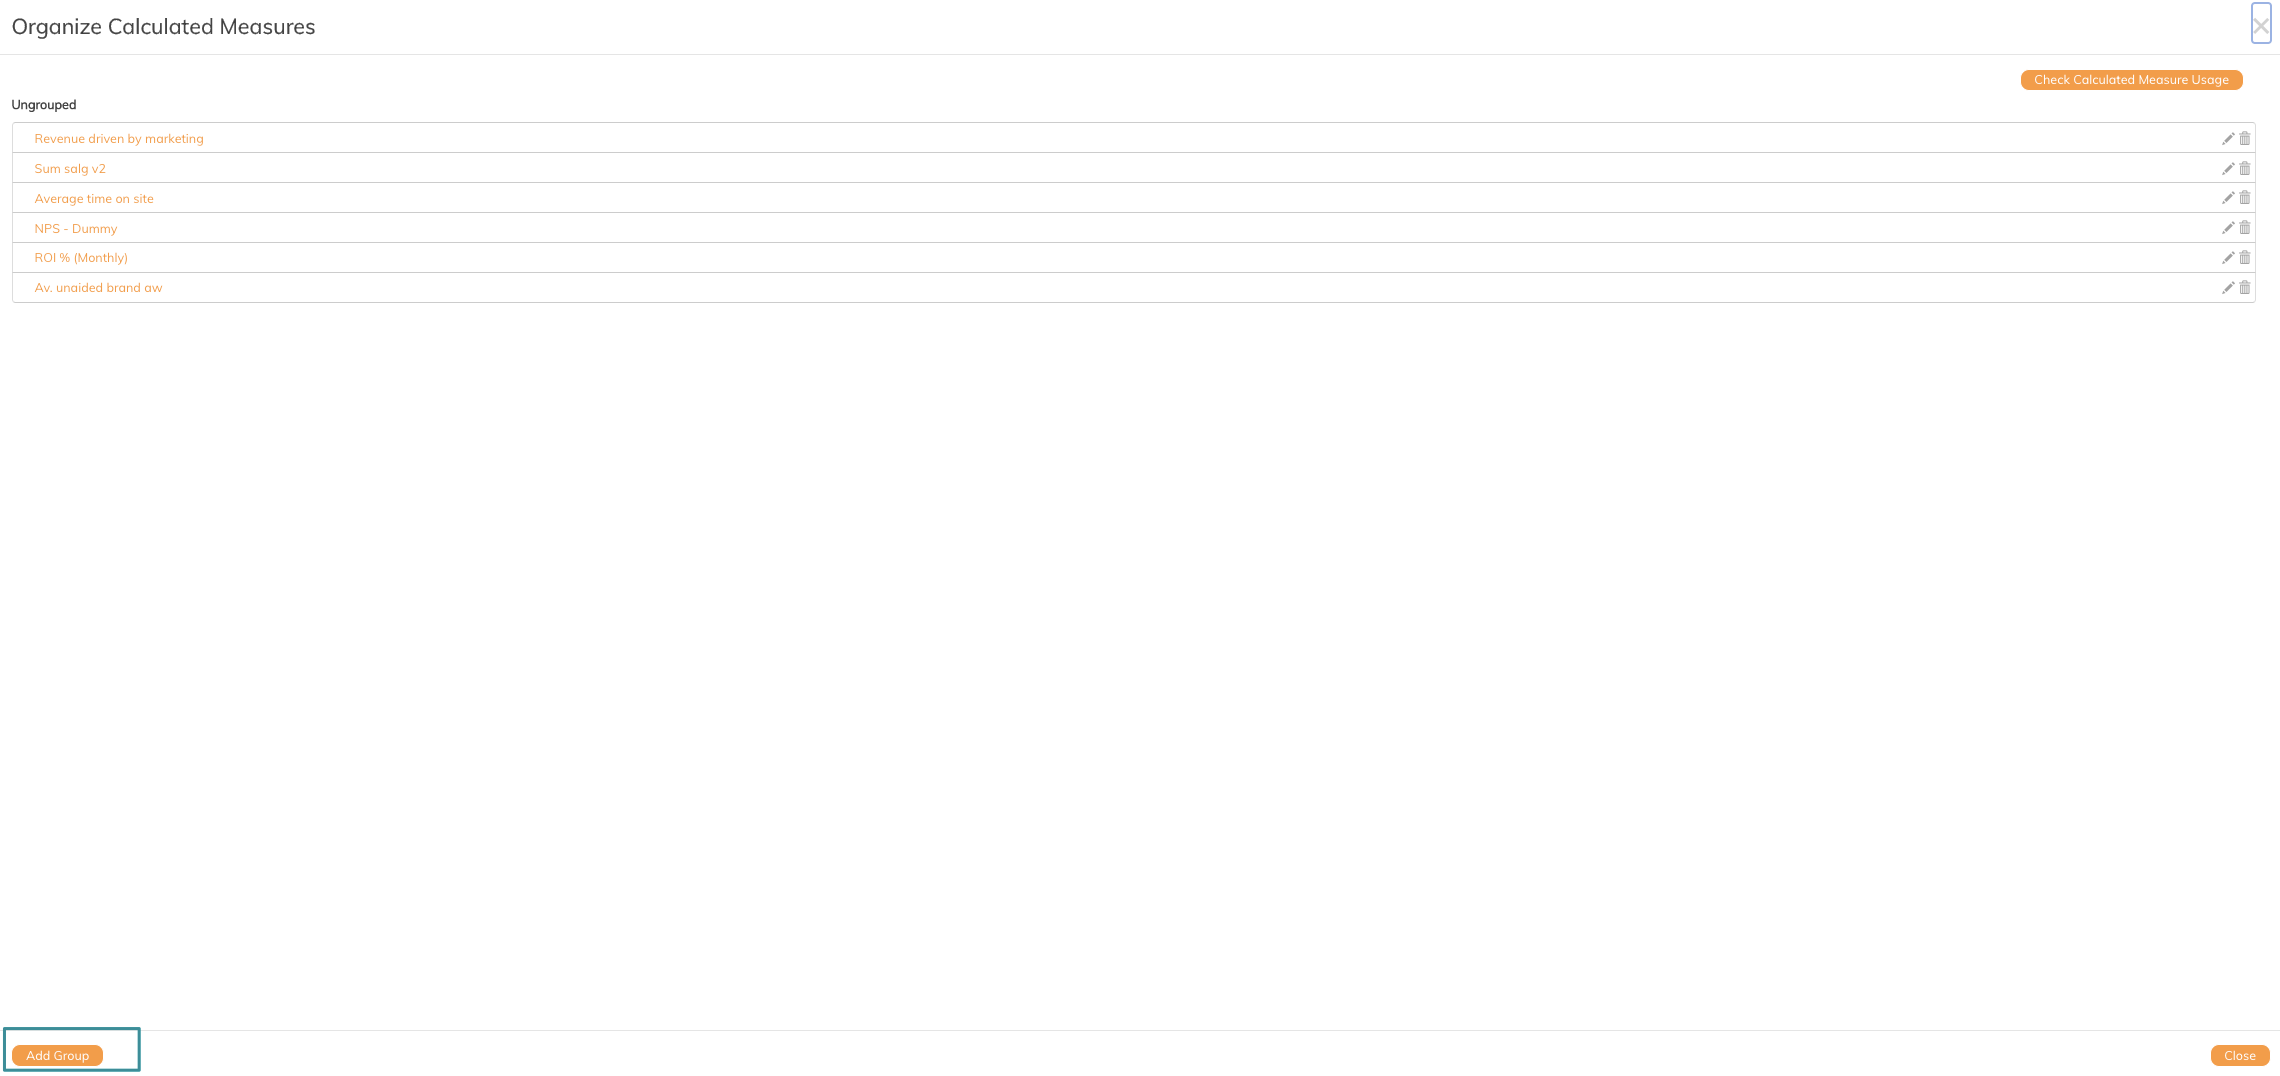
You now see an overview of all calculated measures created in your dashboard.
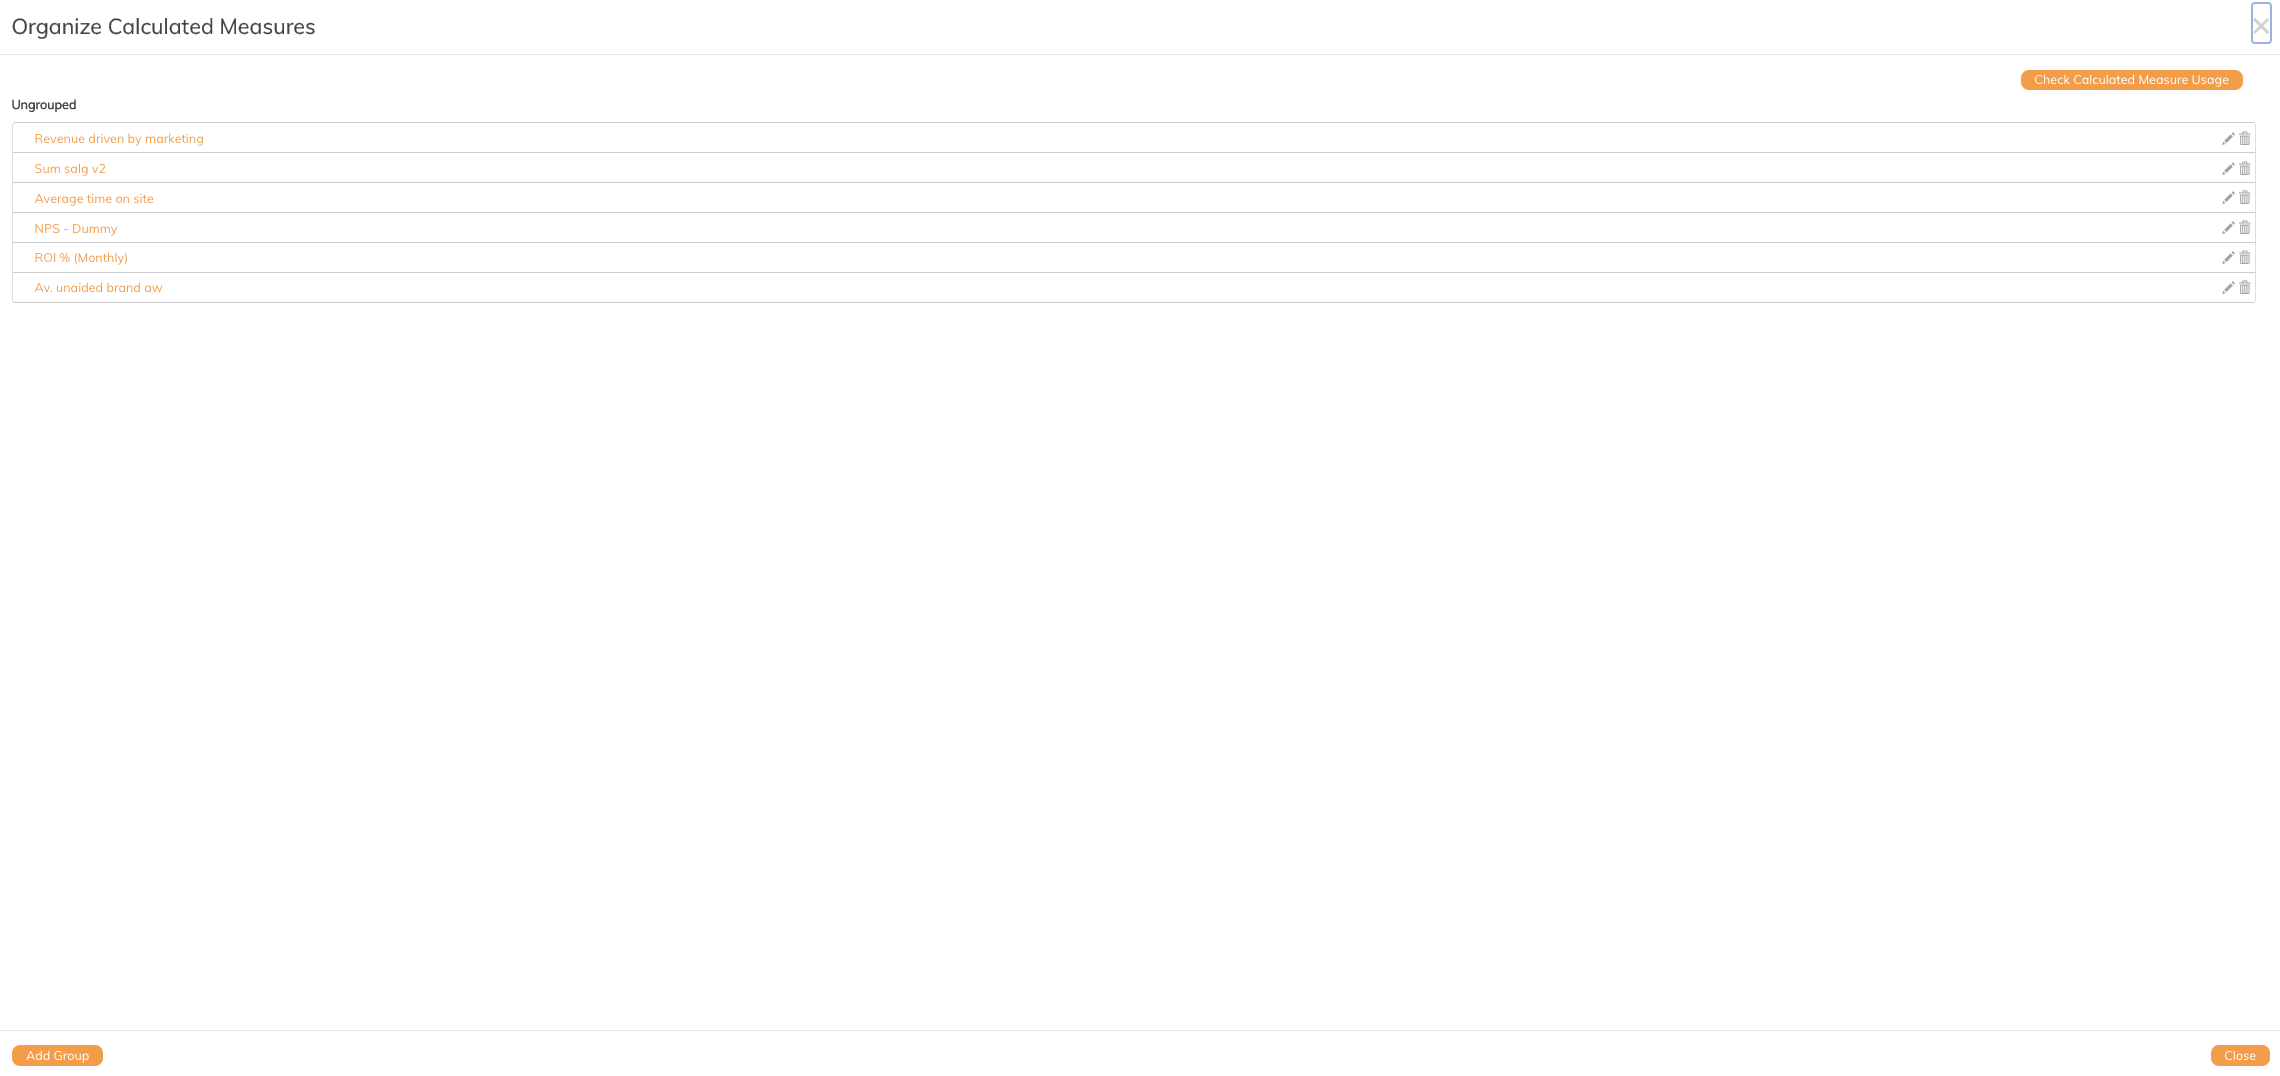
In this example, we are going to create a folder for the calculated measure created in this article [link]
4. Click Add Group
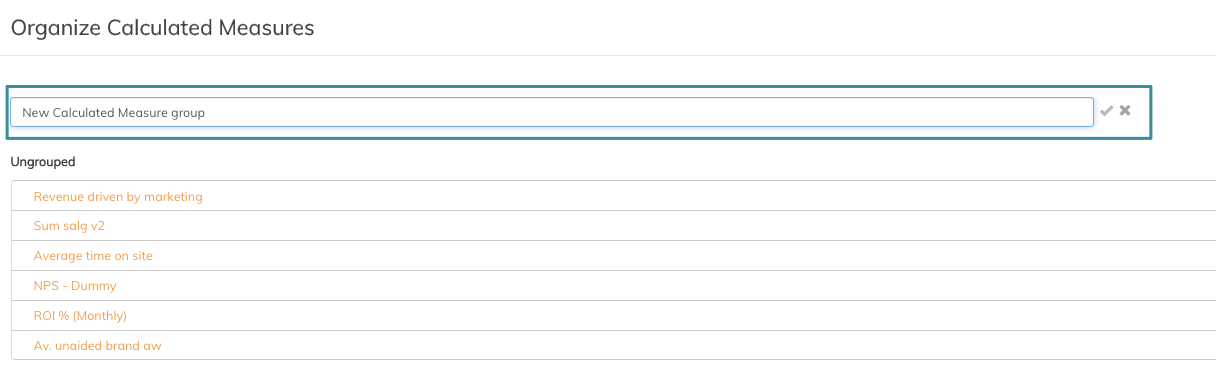
A new field for adding a title on the group appears on top.
5. Insert a title.
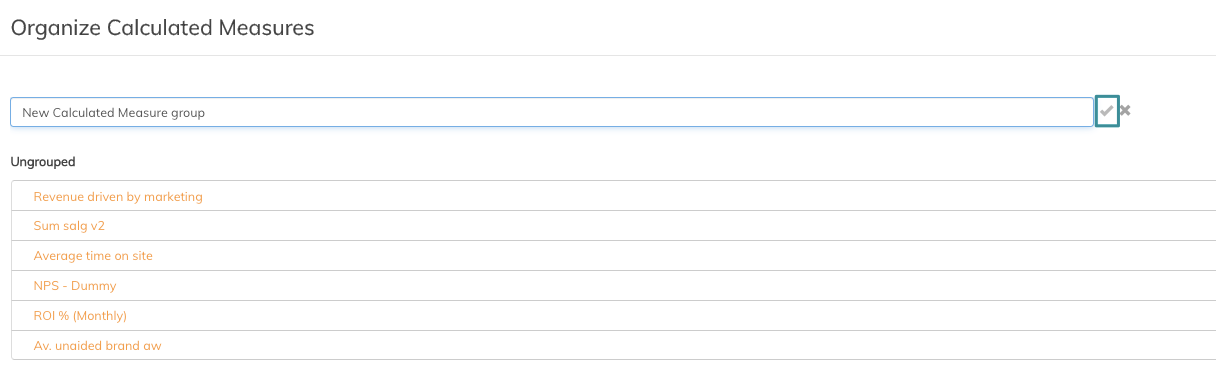
6. Click the tick off icon to save the title
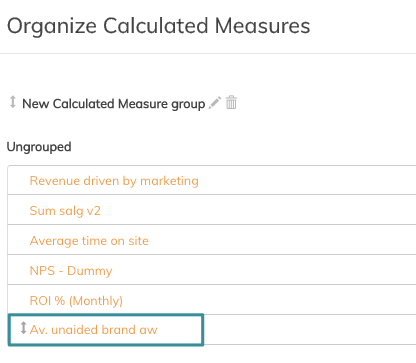
The new group is now available for you to add calculated measures
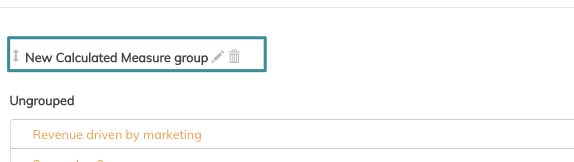
You can now drag and drop your calculated measures into the group by clicking the arrow icon to the left of the calculated measure
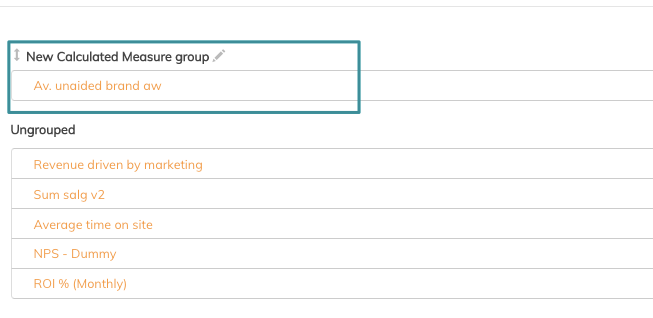
Now the calculated measure is saved in your newly created folder
7. Click Close
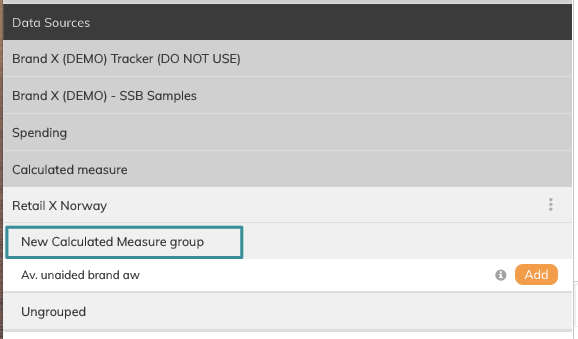
Now your calculated measures group is available in your Data Sources area and it can be used in any graph in your dashboard.
If you have any questions, do not hesitate to contact us on support@penetrace.com