To break down data series on different target groups you can easily create a filter in your dashboard and add this to a data series. Read this article to learn how to create a filter with two variables.
Applies to Trend Monitor
A filter refers to a data series that is broken down to one or more background variables. An example is if you want to see awareness broken down to male or female.
Before you can create a filter, make sure you have
- Access to your dashboard
- Edit or Admin access rights
- A graph - either an already created or create a new graph
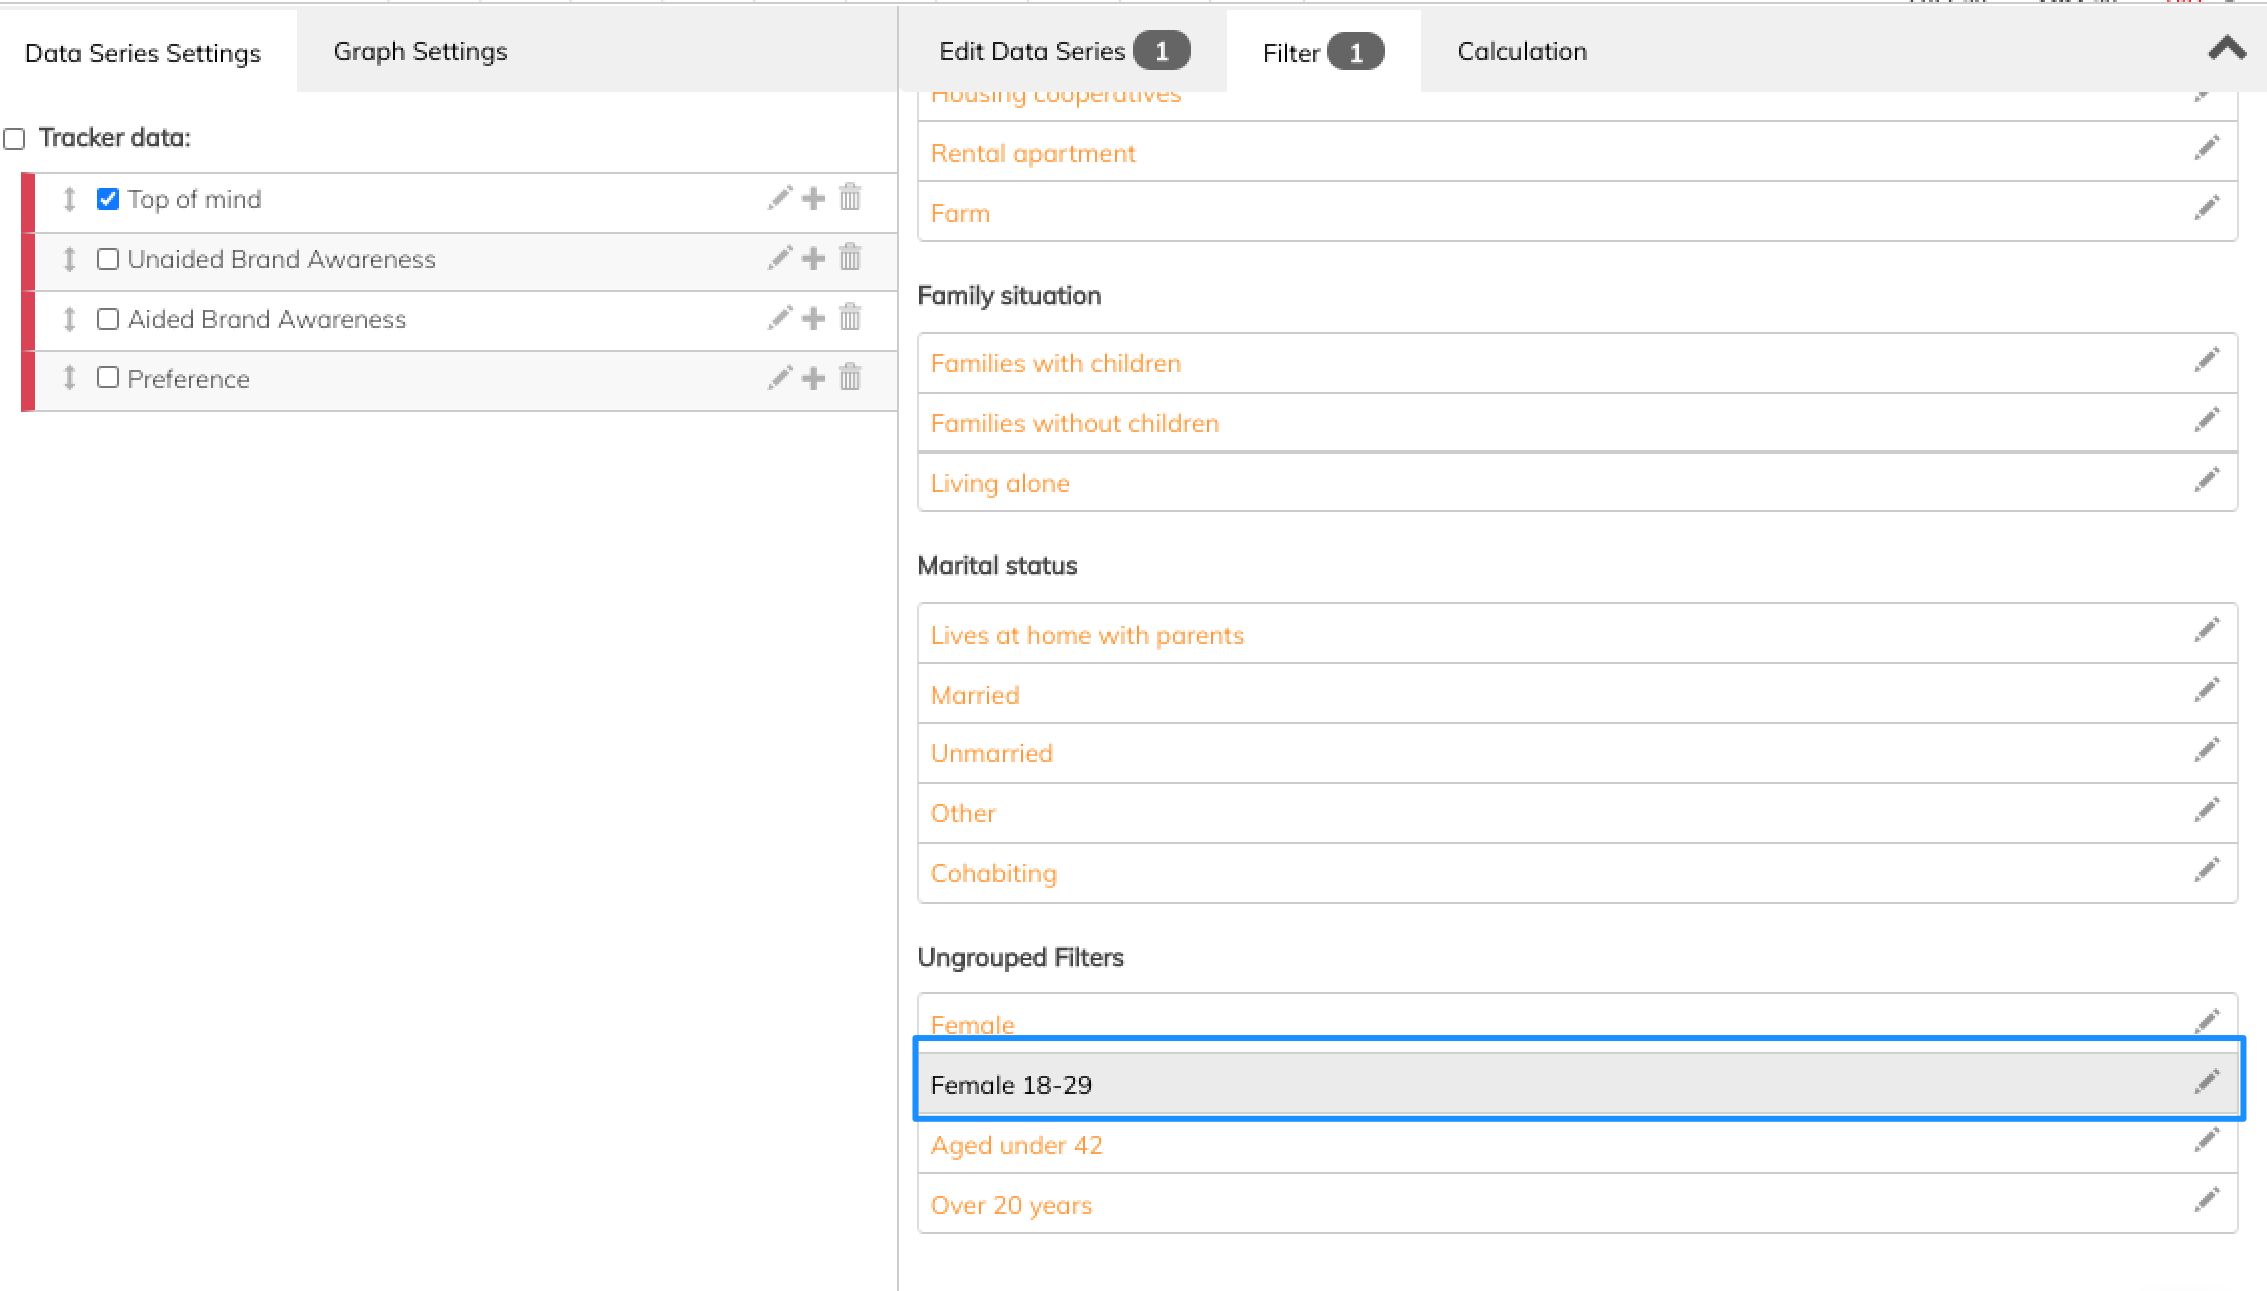
In this example, we are going to create Females 18-29 as a filter.
Follow these steps to create a filter:
1. Click Edit in a graph.

You are now in edit mode.
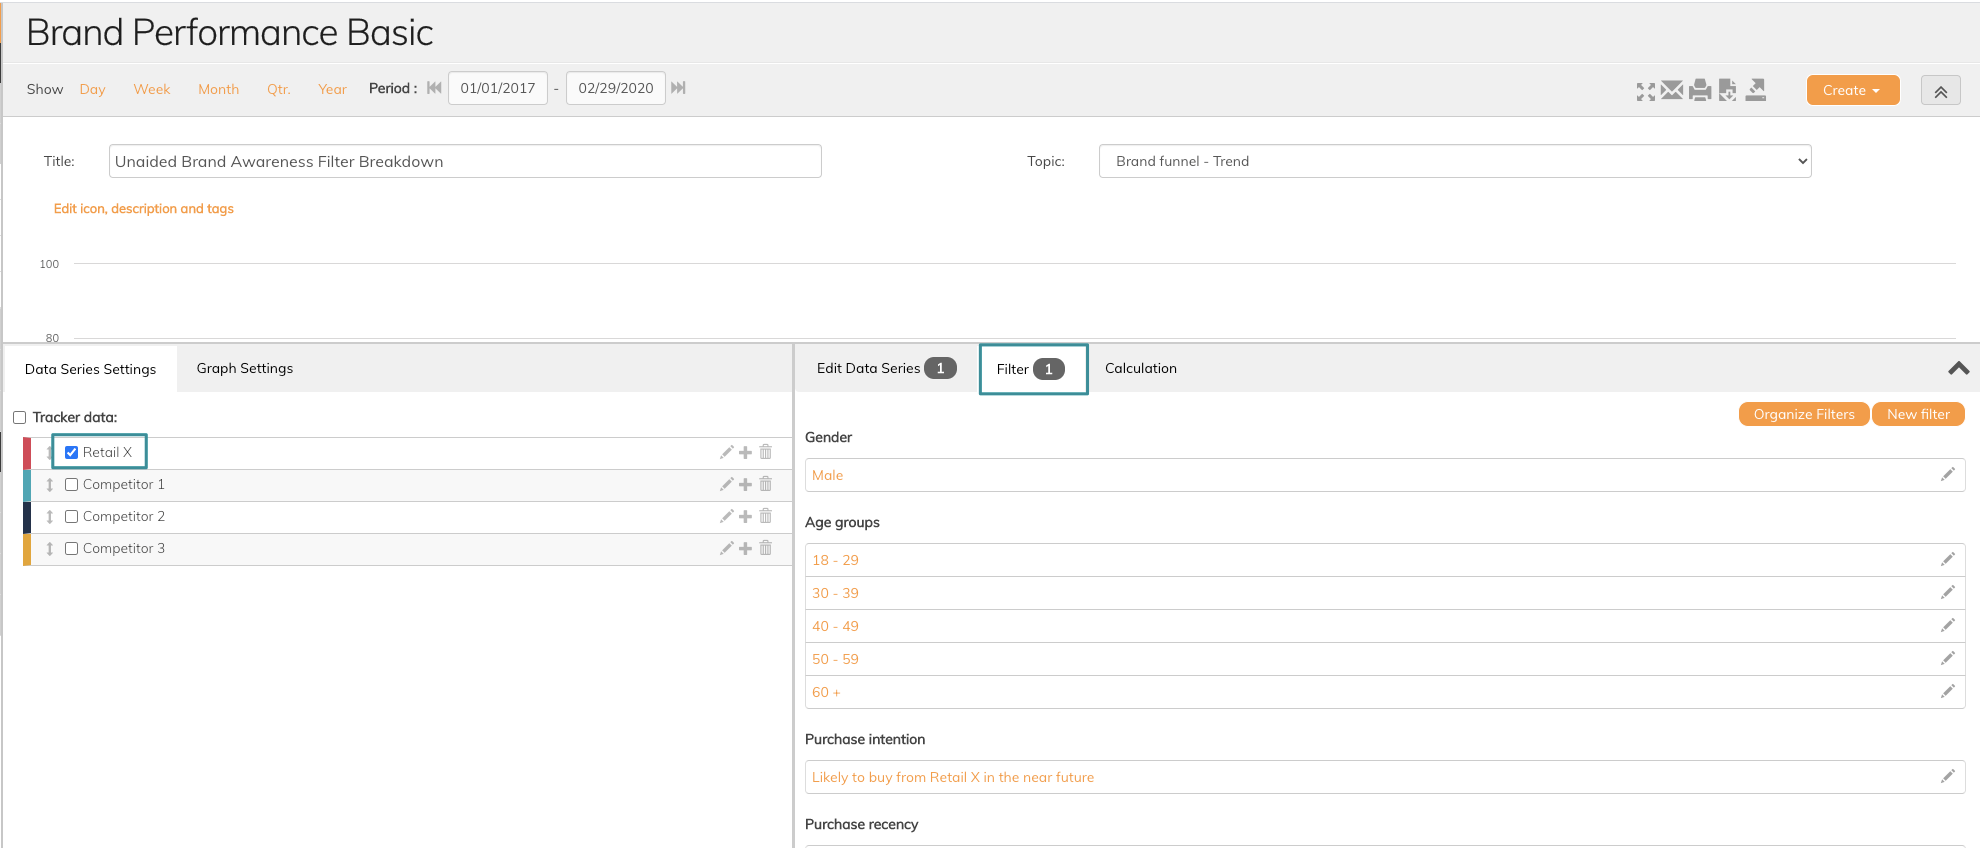
2. Tick off any of the data series added to the graph. Click Filter on the right side.
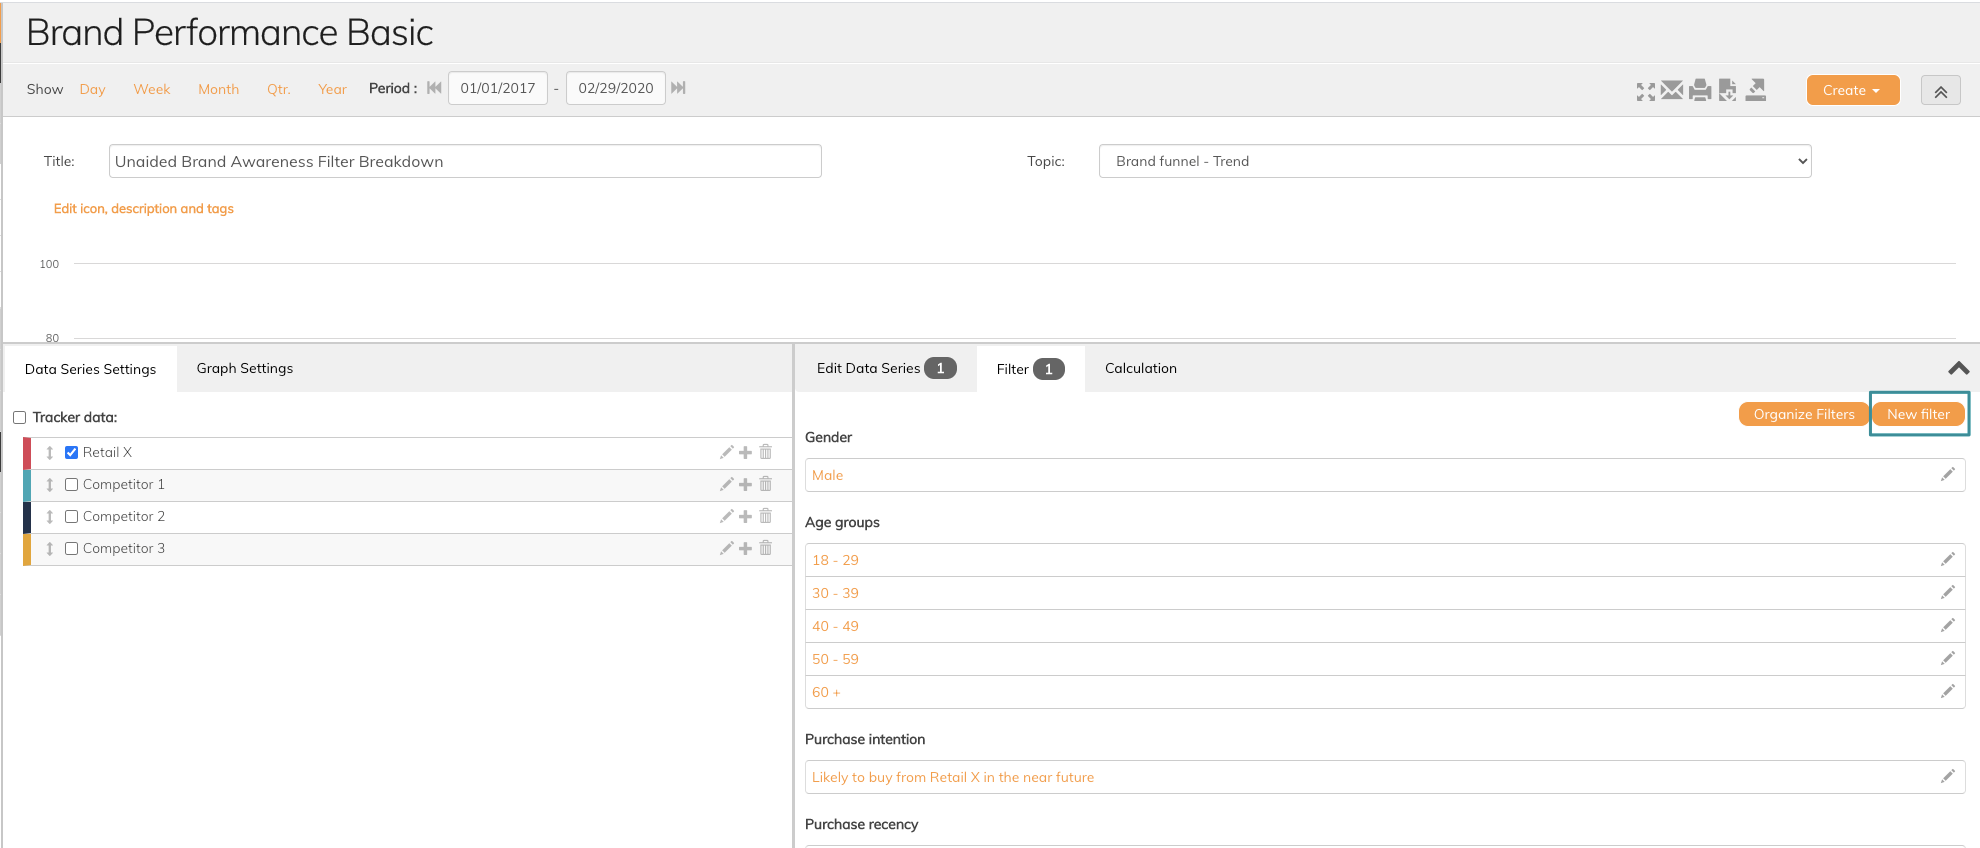
3. Click New Filter
4. Add a title to your filter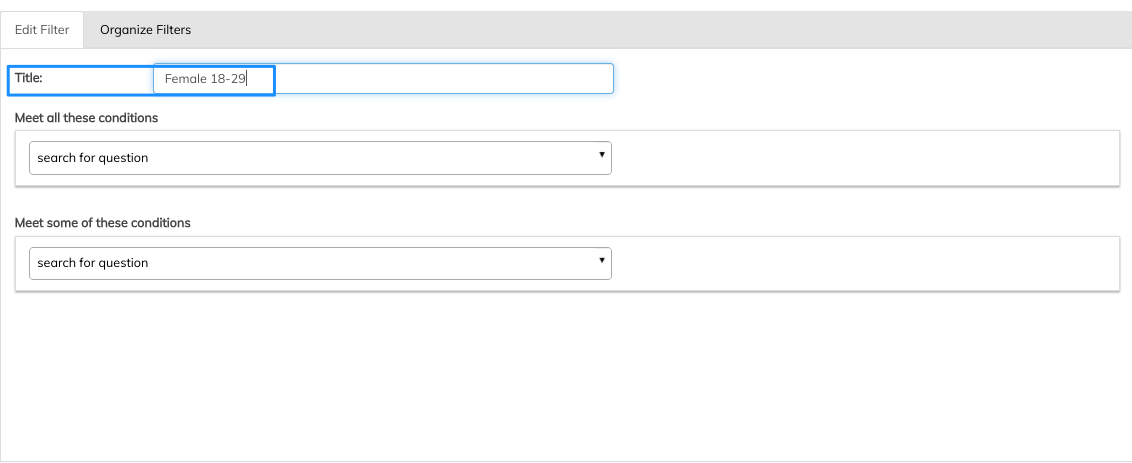
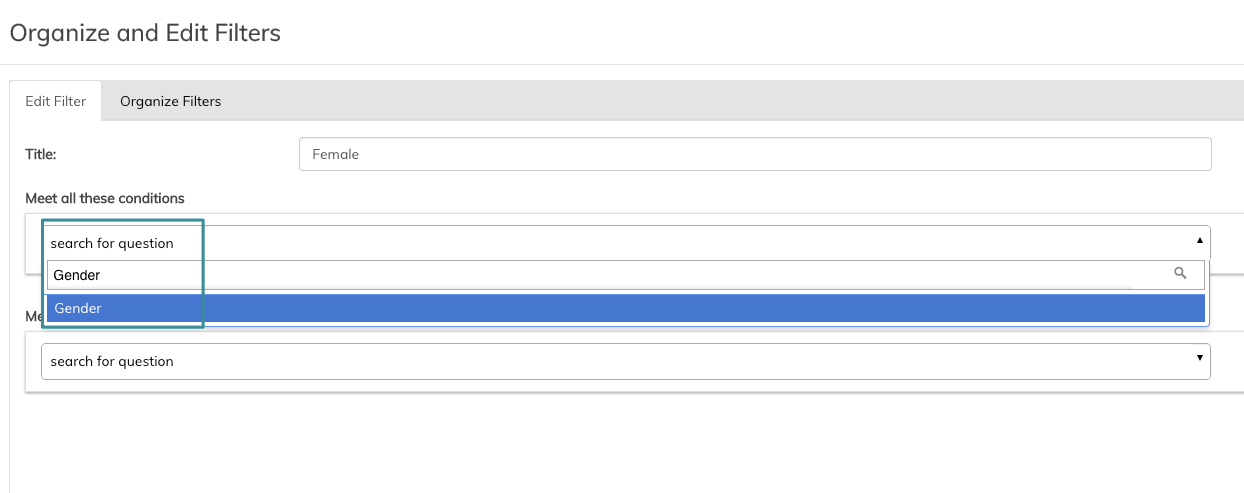
5. Search for the specific question on which you want to create the filter, in this example Gender
6. Enter the operator on which you want to select the filter, in this example Equal (Gender Equals to Female)
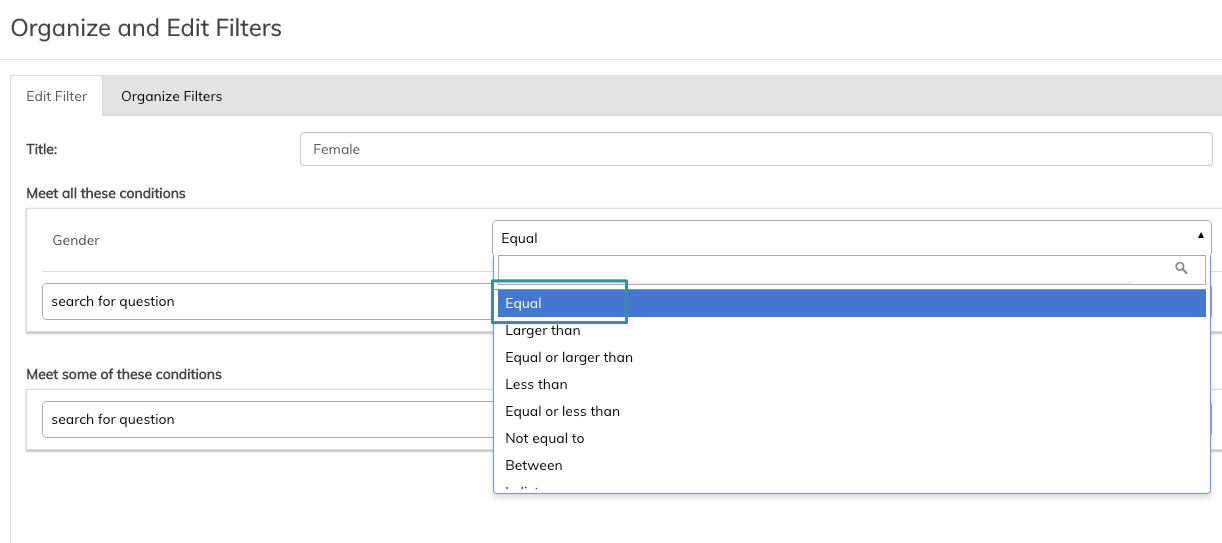
7. Choose the right alternative in your question, in this example Female

8. Search for the specific question on which you want to create the other filter variable, in this example Age
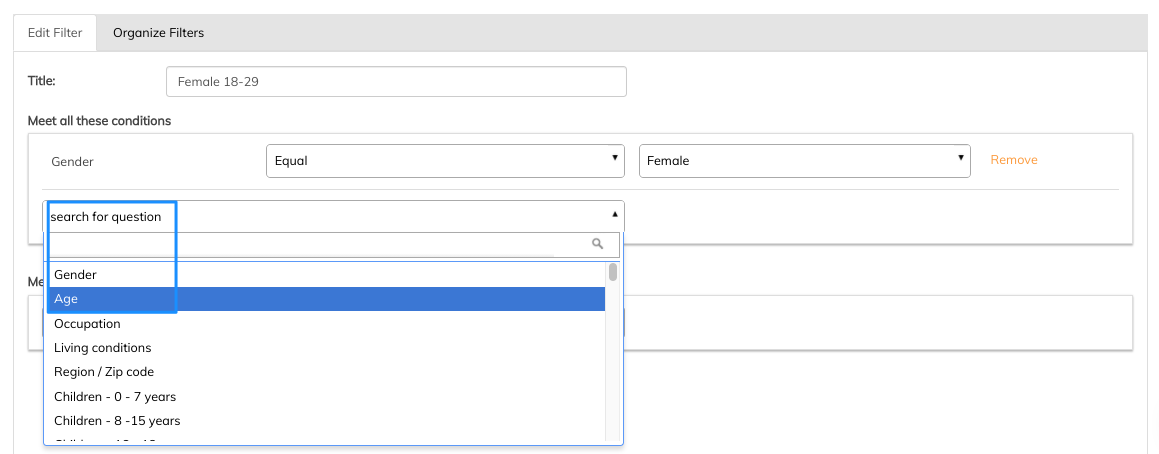
9. Enter the operator on which you want to select the filter, in this example Between (Age between 18-29)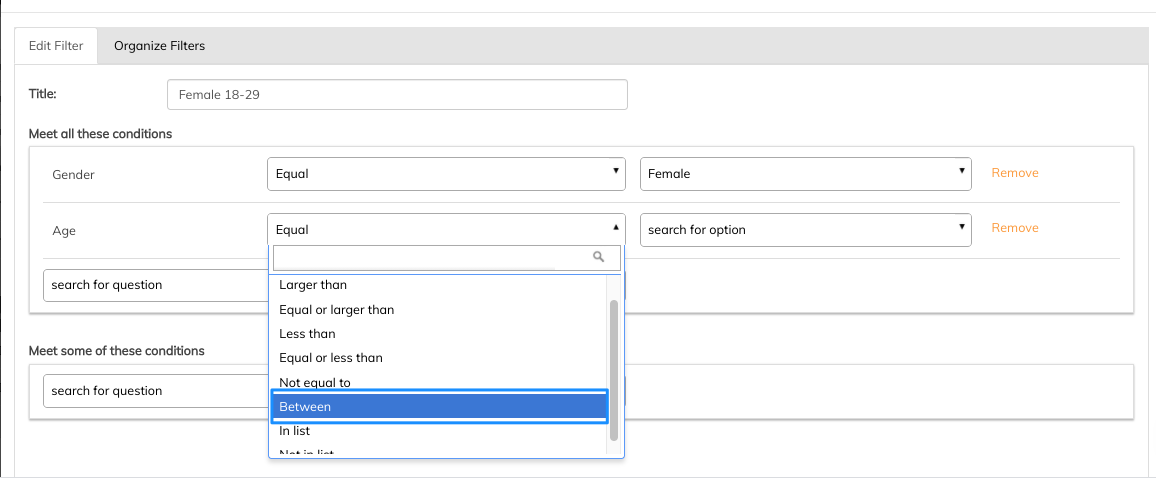
10. Choose the right alternative in your question, in this example 18 and 29
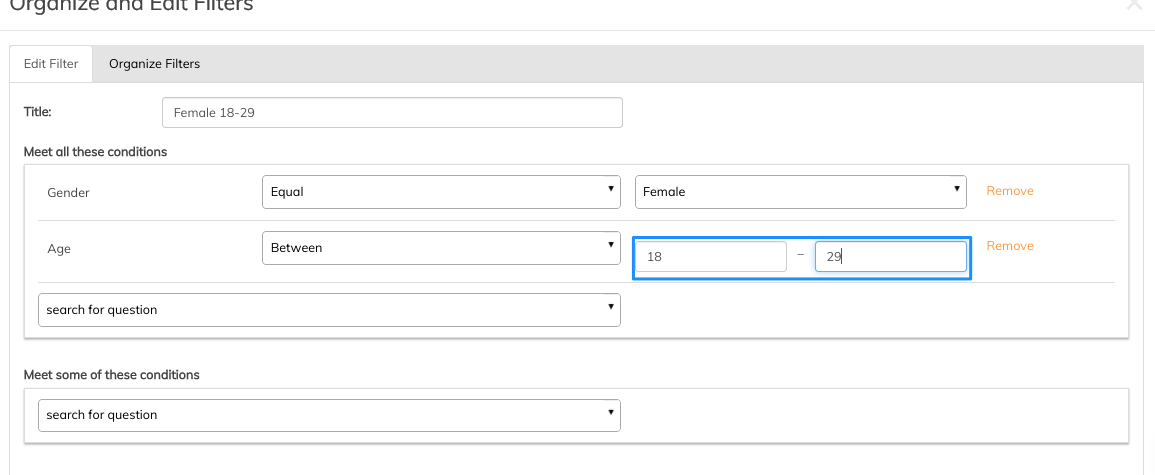
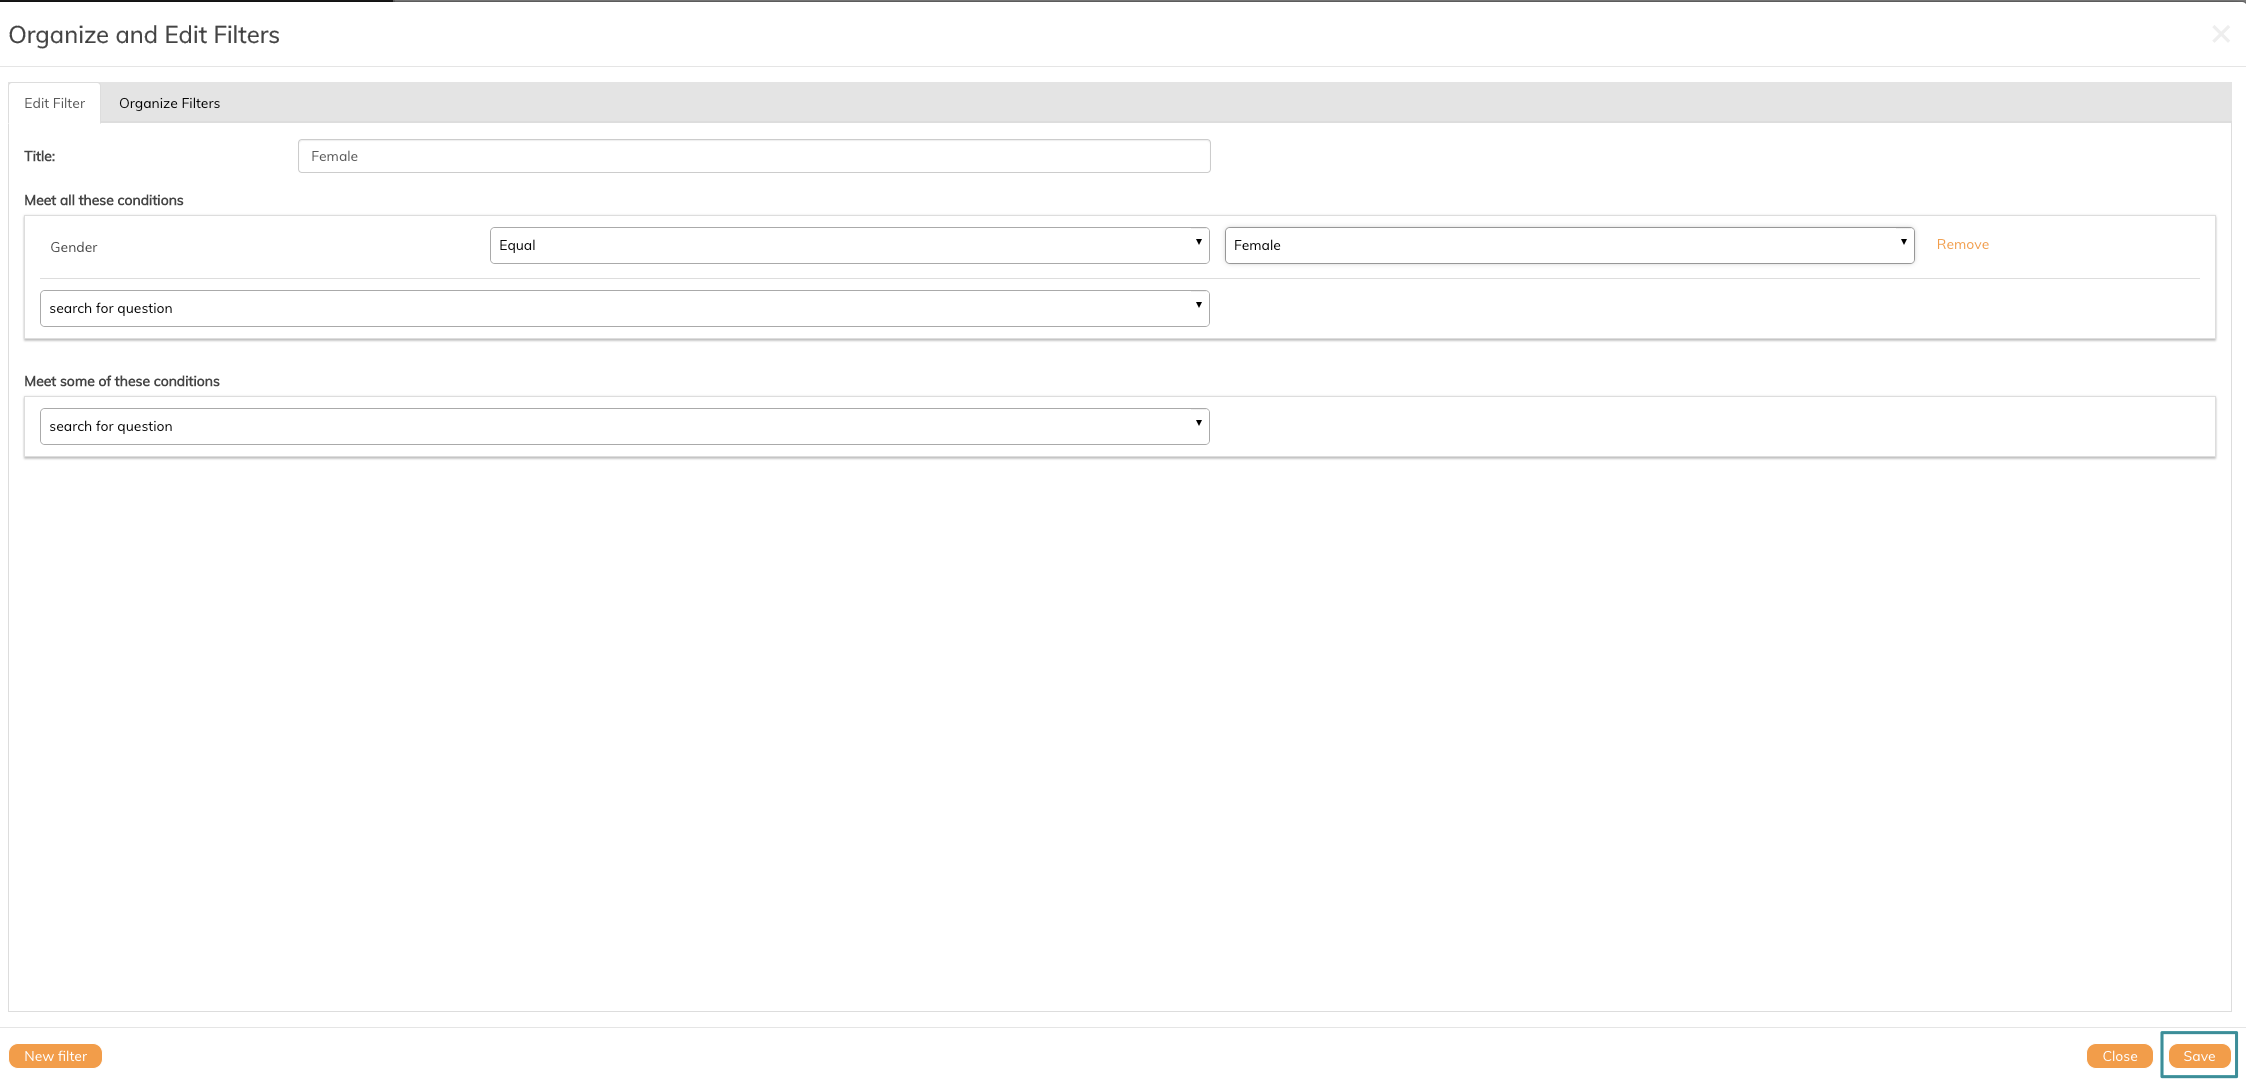
11. Click Save
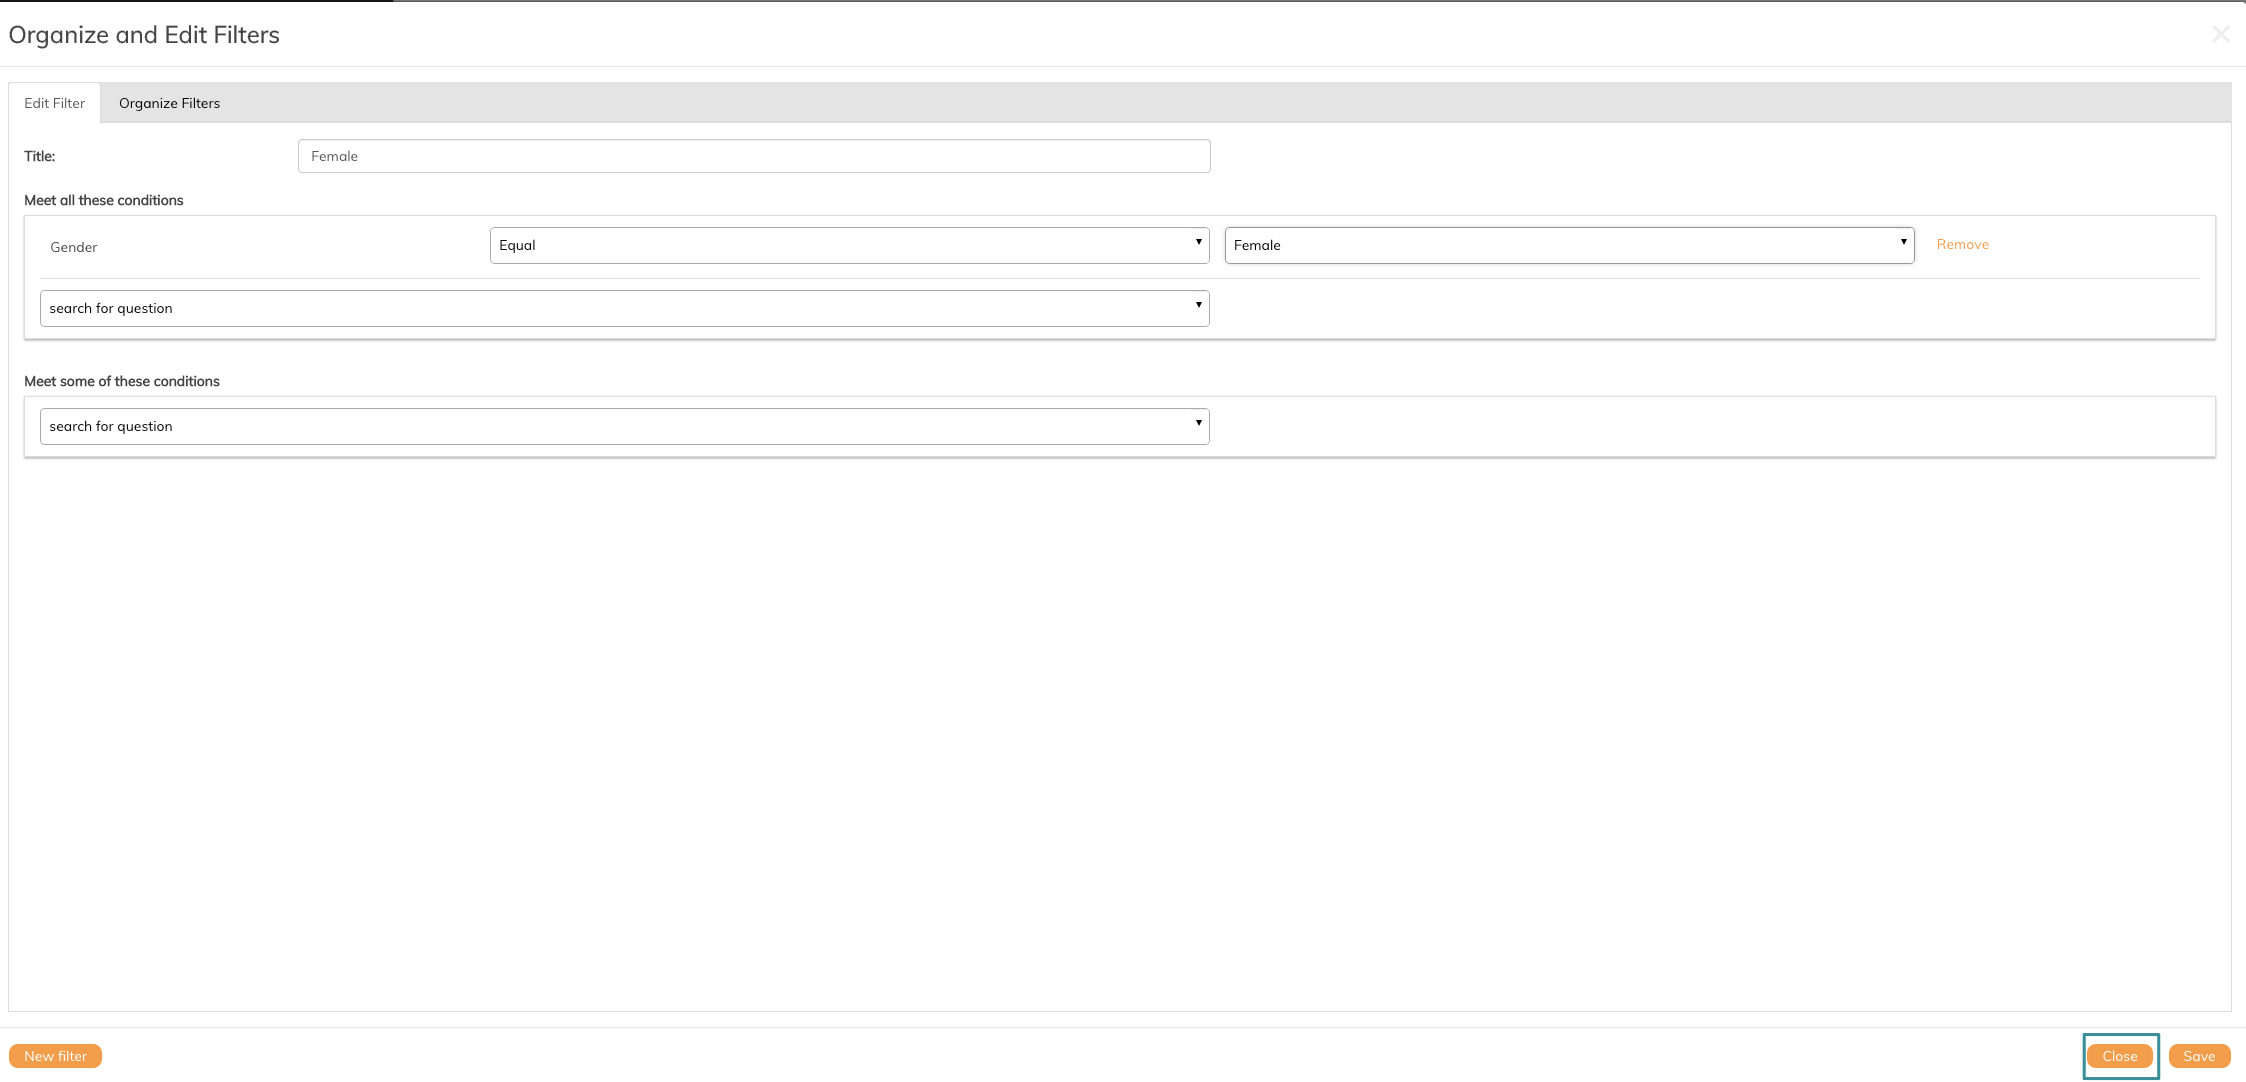
12. Click Close
Scroll down to the bottom of the filter list and the new filter will be visible under Ungrouped filters
Read this article if you want to learn how to organize your filters.
If you have any questions, do not hesitate to contact us on support@penetrace
