In order to edit graph settings the following must be in place:
1) Access to your dashboard
2) Editor og admin access rights
To edit graph setting follow these steps:
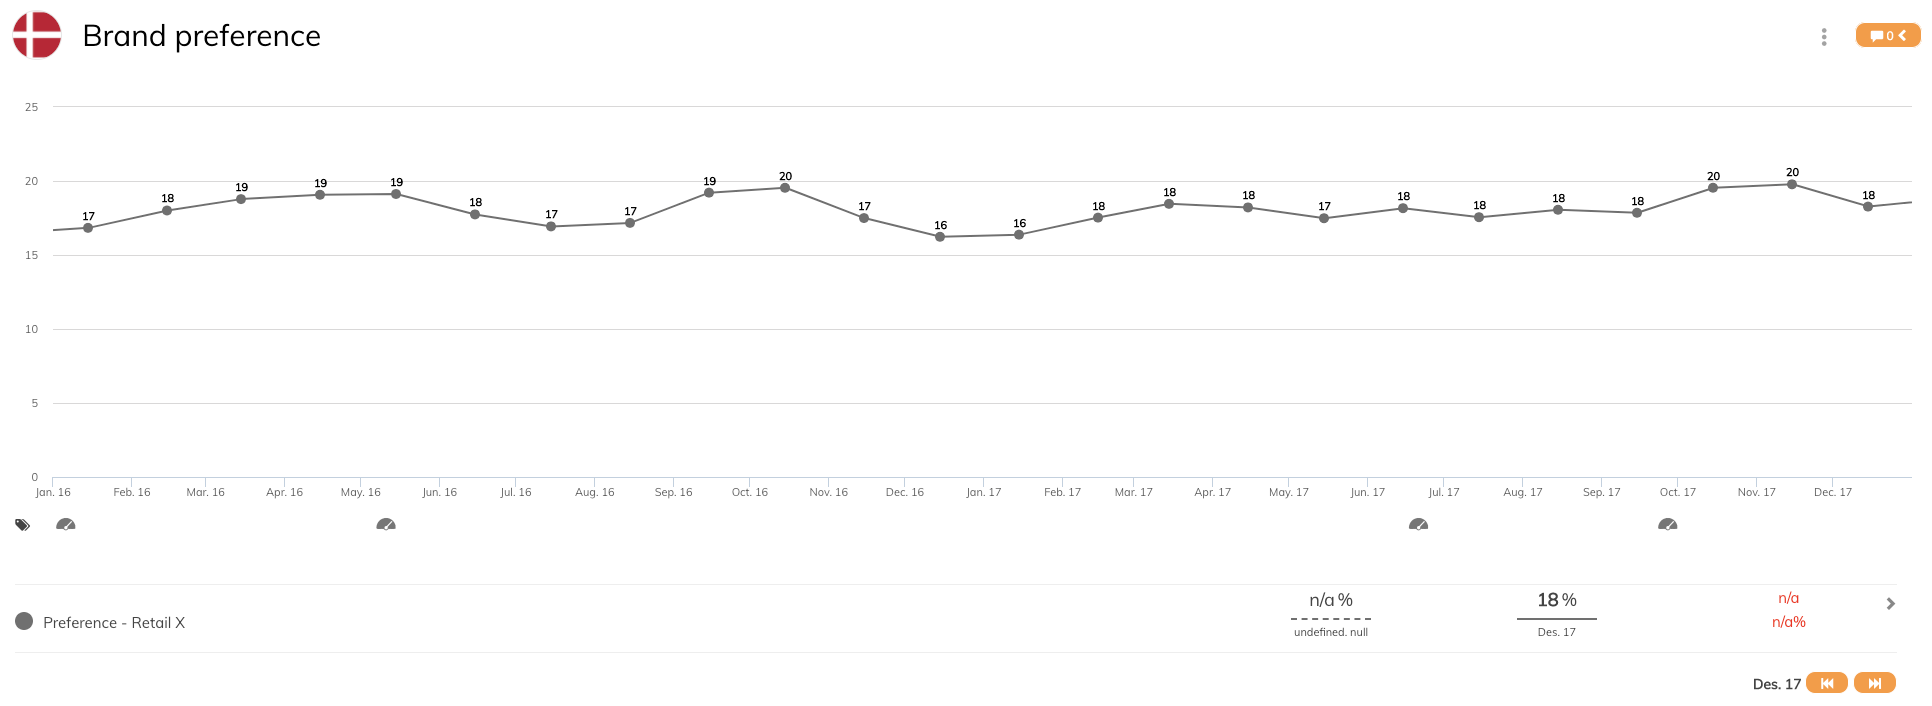
1. Navigate to the graph you want to edit
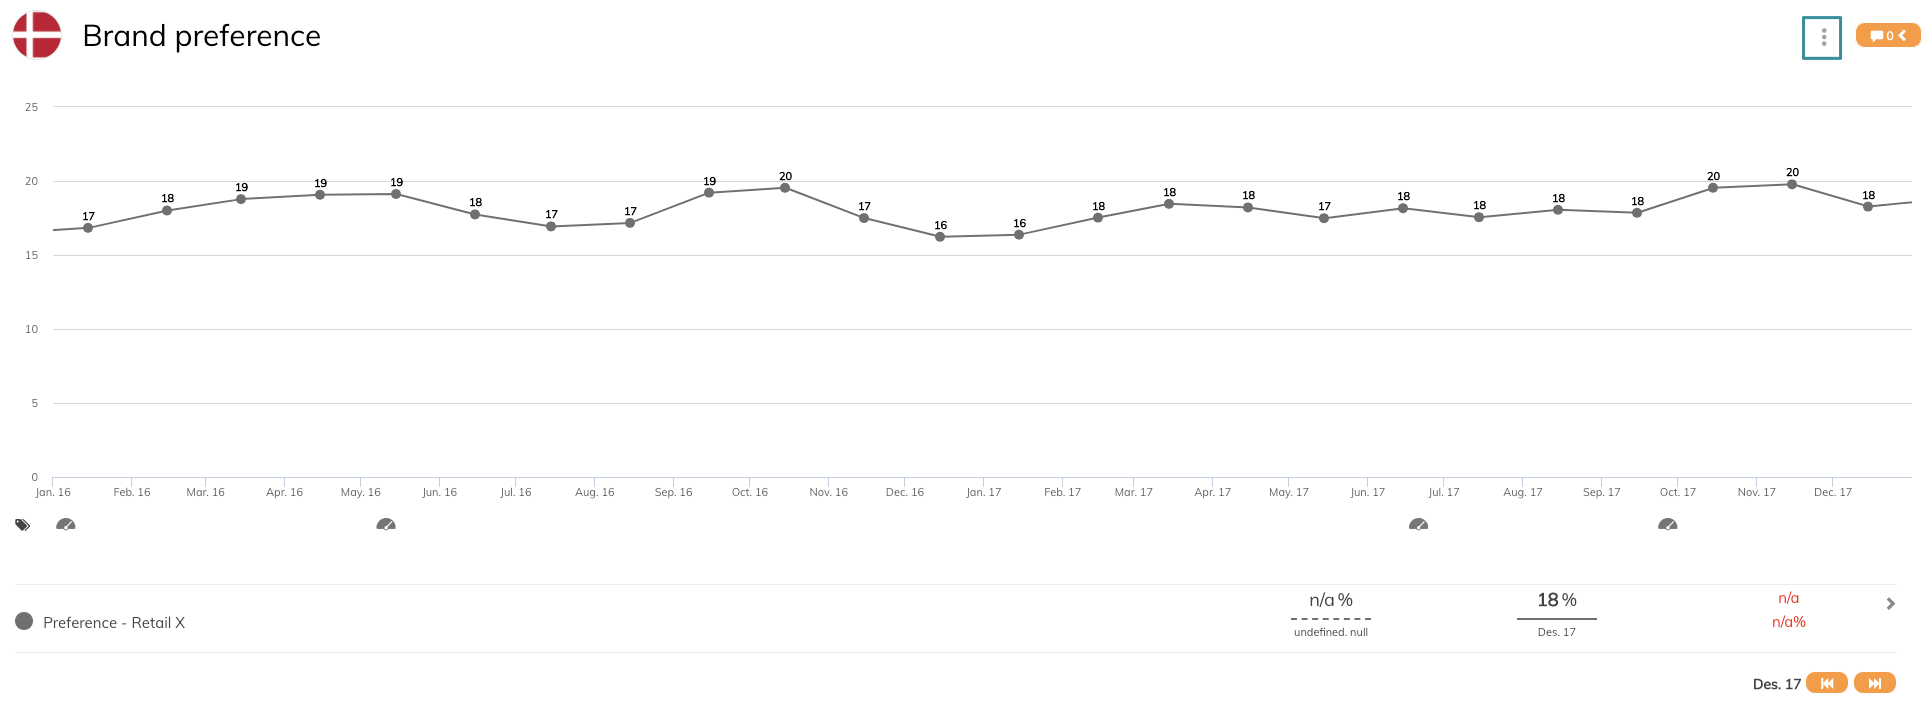
2. Click on the three dots in the top right corner
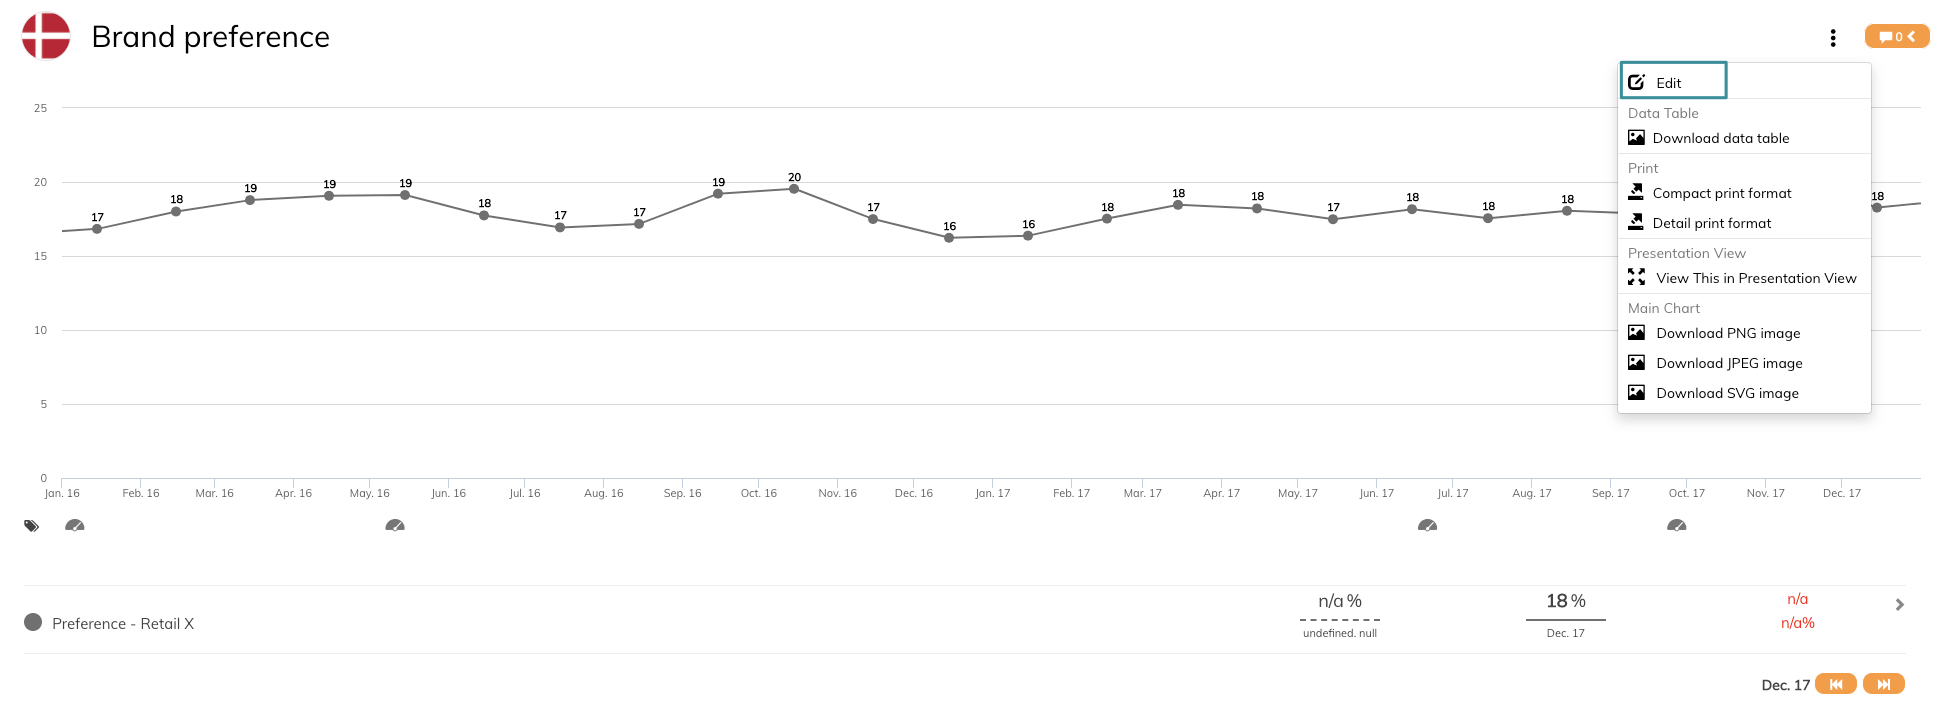
3. Choose Edit
You now enter edit mode for this graph. This graph shows a trend view of the data series. The graph is set to 100% view for the chart and legend is placed under the chart. We can also see that comparison is enabled.
4. Click Graph Settings
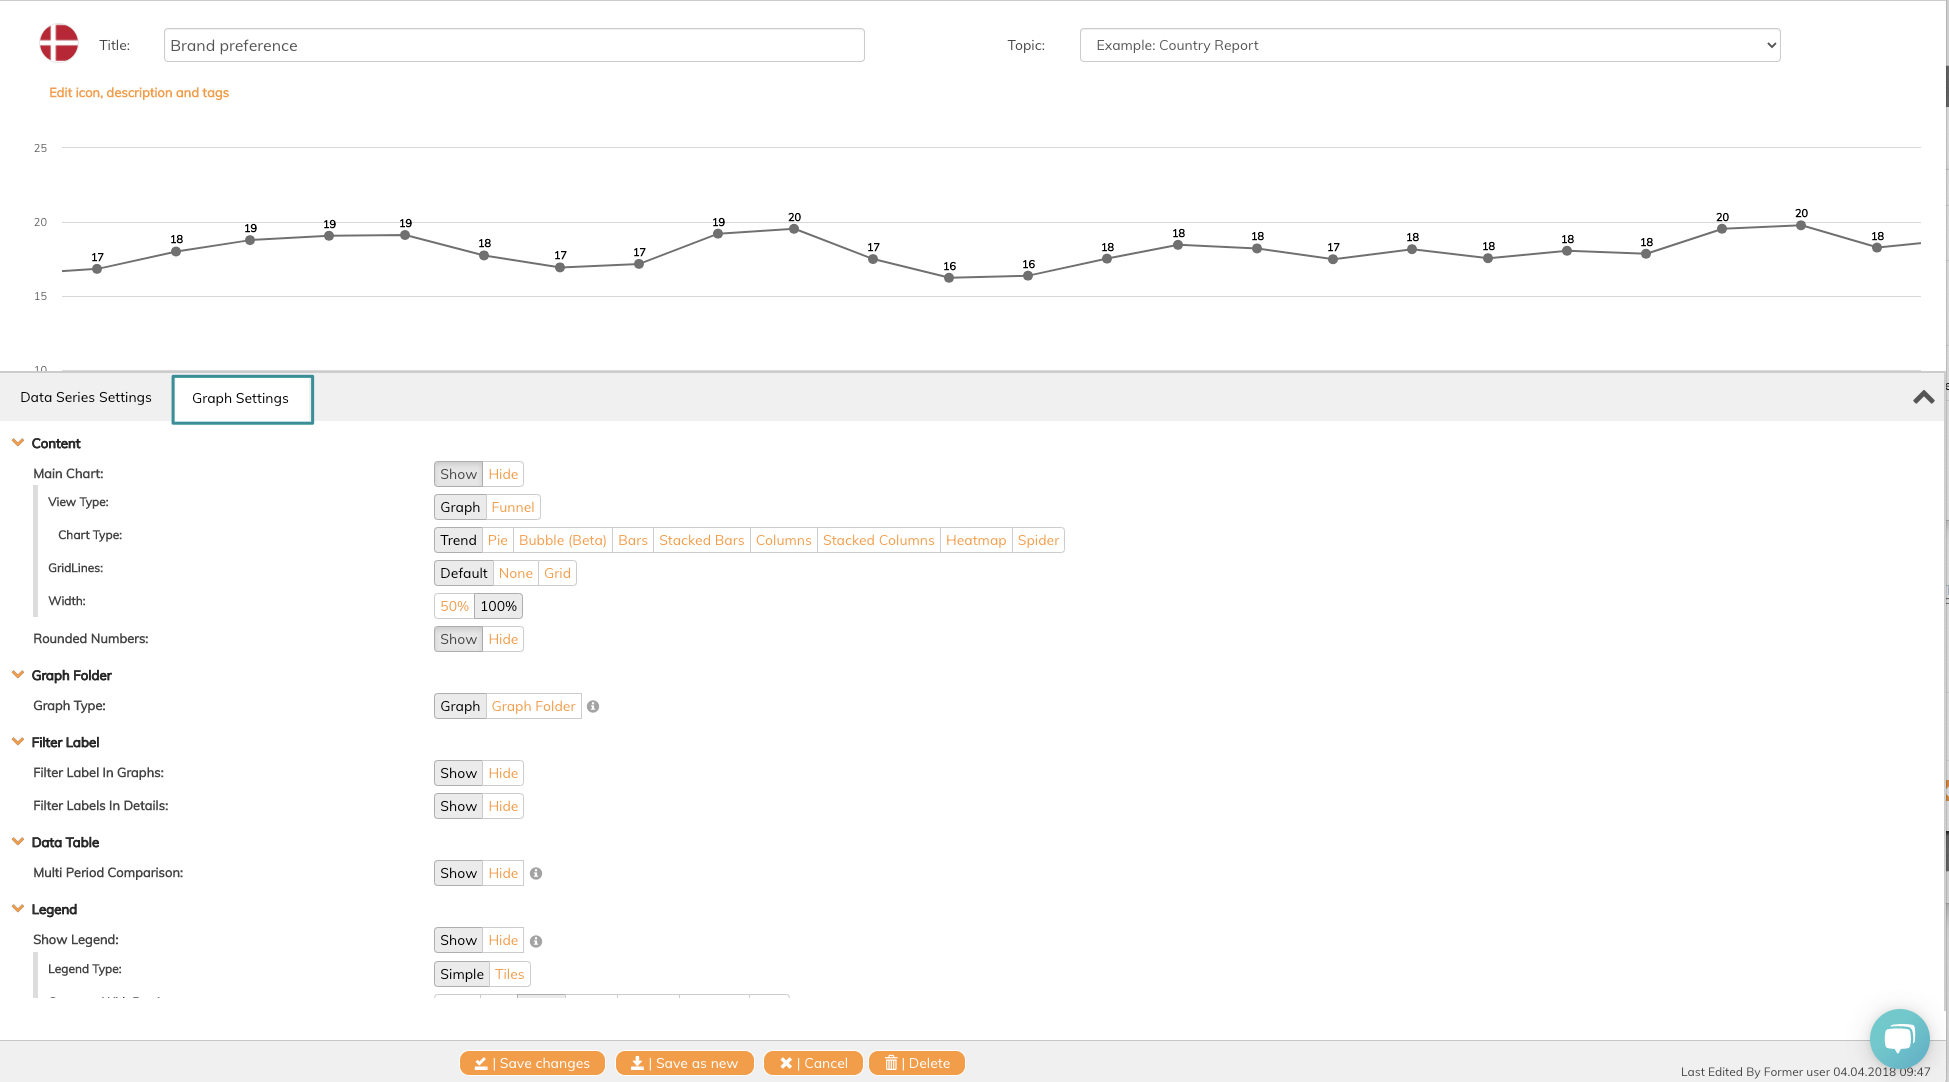
You now enter the settings page for all graph settings.
We will now change the graph width and change the comparison from weekly to monthly comparison.
5. Click 50% on width
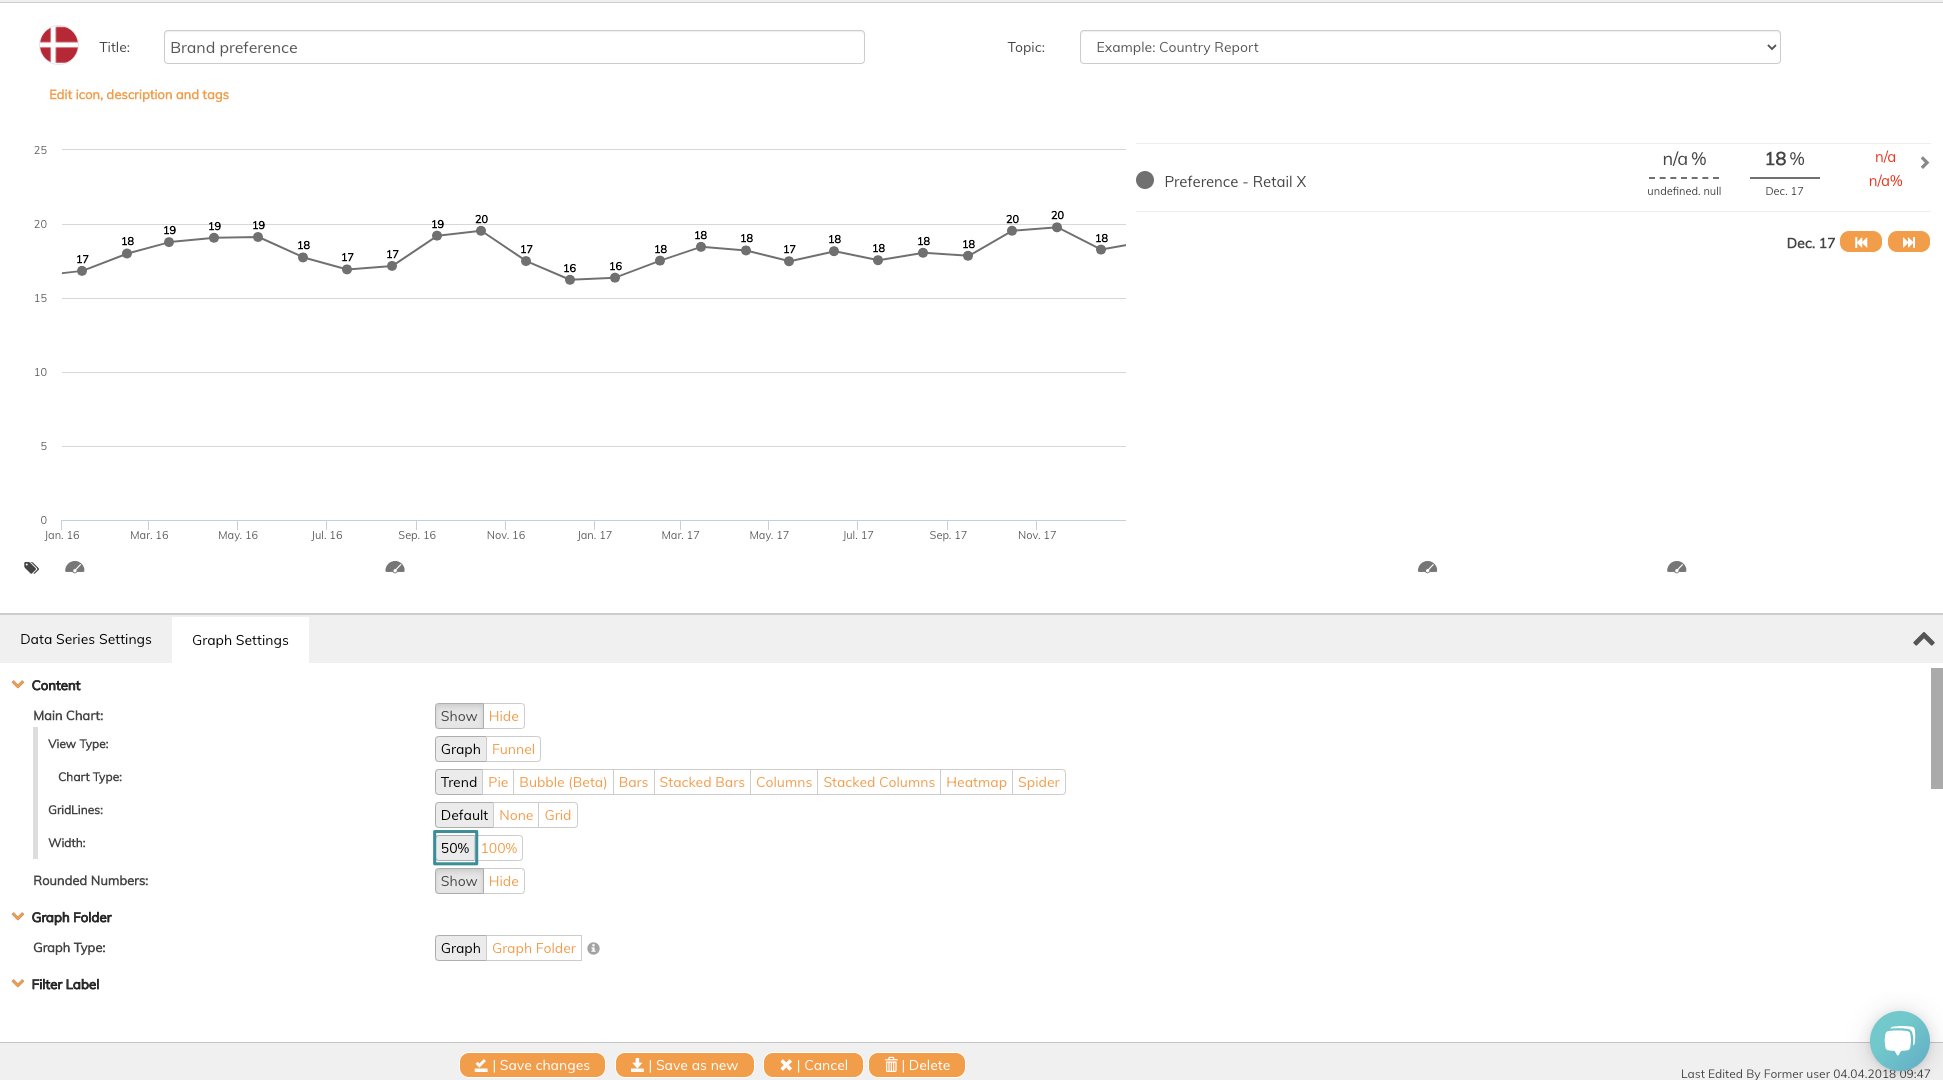
You can now see that legend is moved from below the graph to the right.
6. Scroll down to Legend and Compare with previous Month
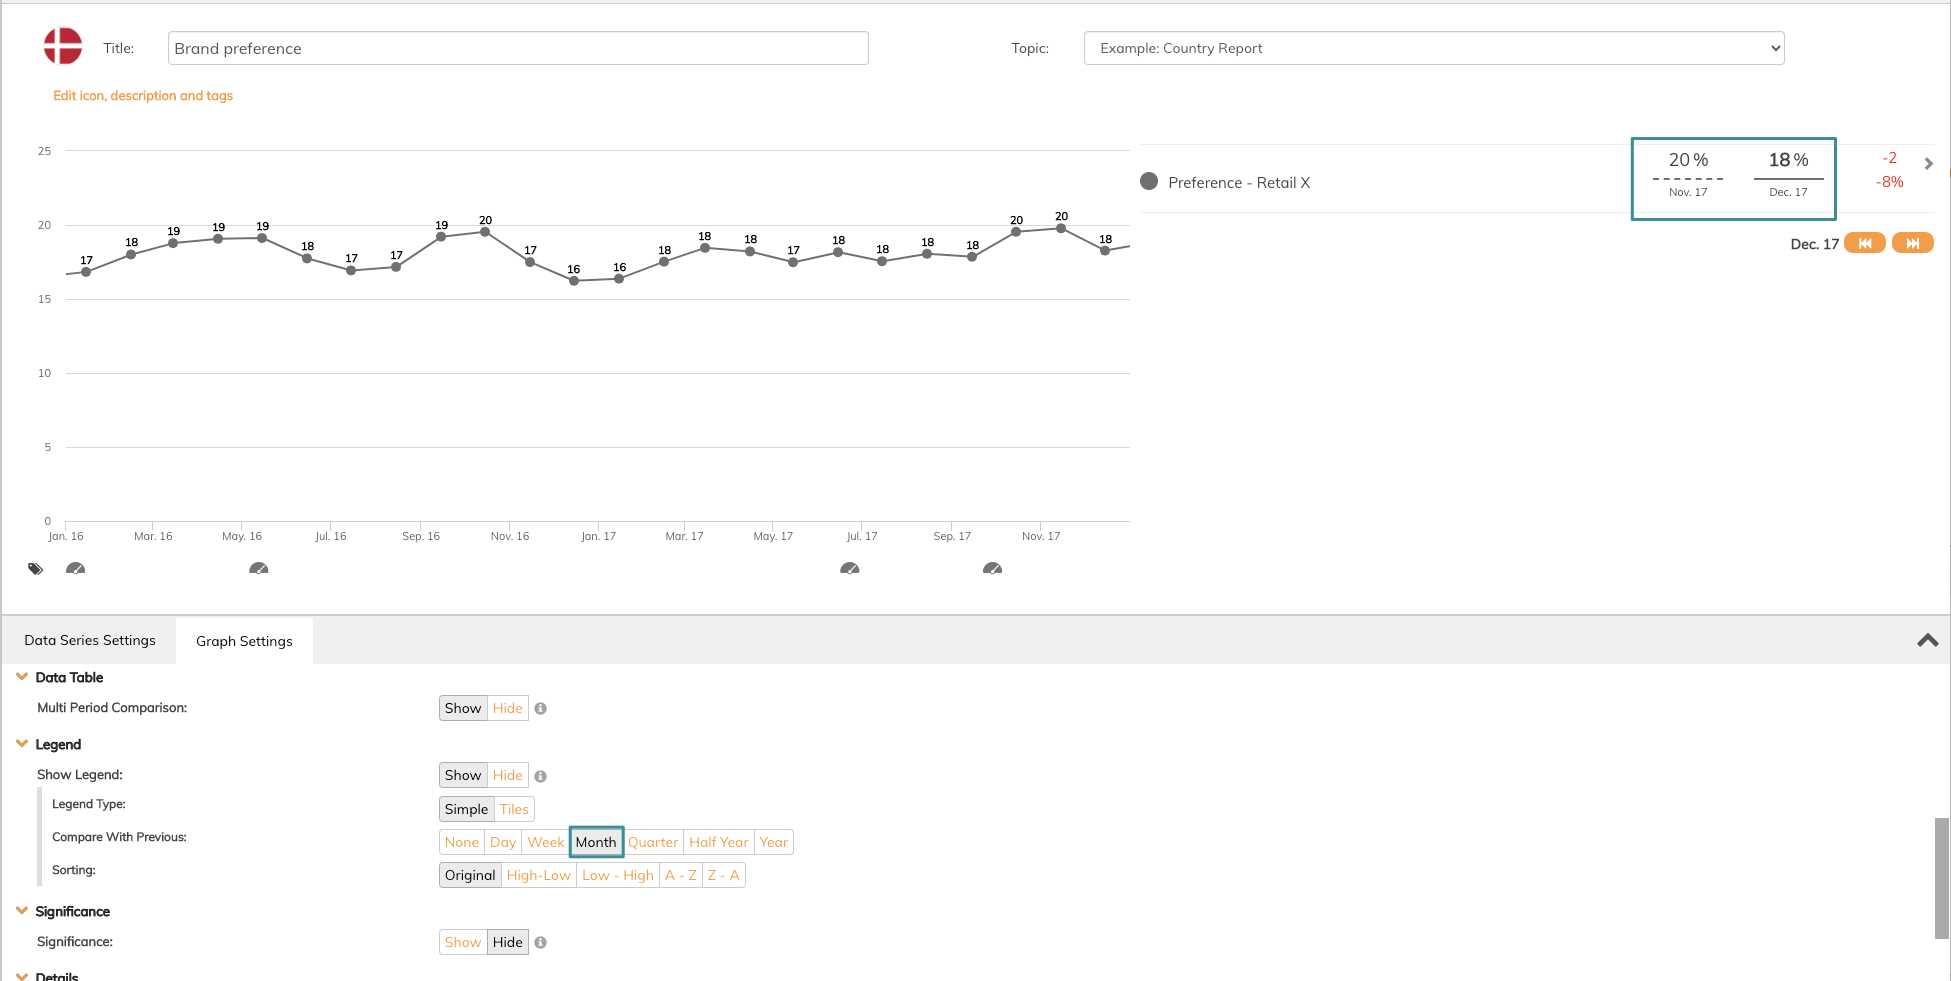
The comparison has changed and shows the number from last month instead of last week.
Remember to Save changes.
Read this article to get an overview of all graph settings available and how they impact the visualisation in your dashboard.
If you have any questions, do not hesitate to contact us on support@penetrace.com