Target group breakdown refers to functionality in Graph settings that allows you to see how a data series perform in different target groups or filters. This function can be convenient to use if you quickly want to explore the data series distribution in different target groups or filters.
Read more about graph settings in this article.
To enable Target group breakdown the following must be in place:
- Access to your dashboard
- Editor or admin access rights
- Already created graph(s)
- Already created filters (target groups)
Follow these steps to enable and use target group breakdown:
1. Click Edit in a graph
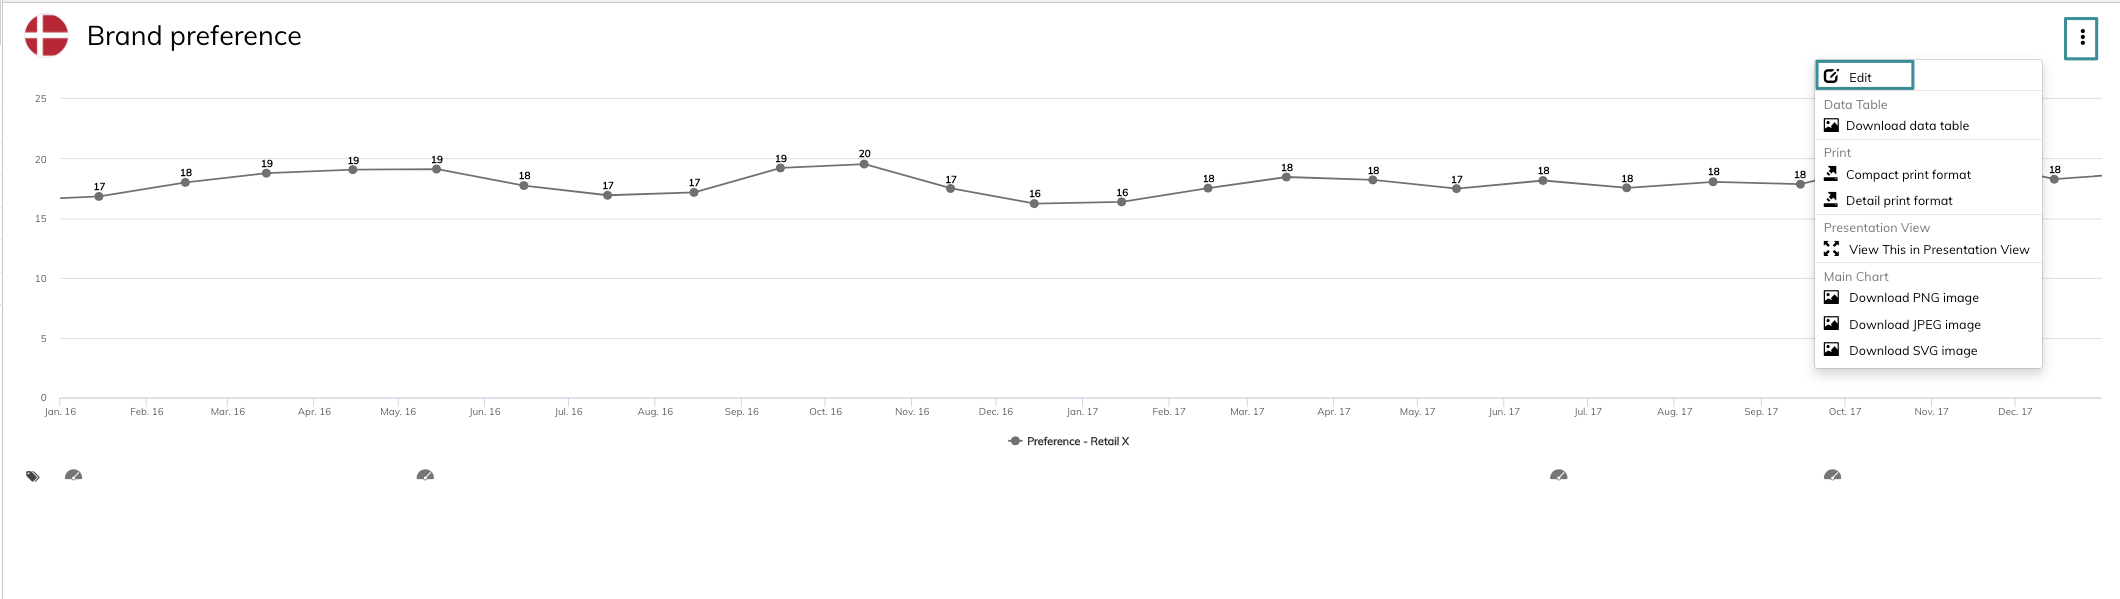
2. Click Graph Settings
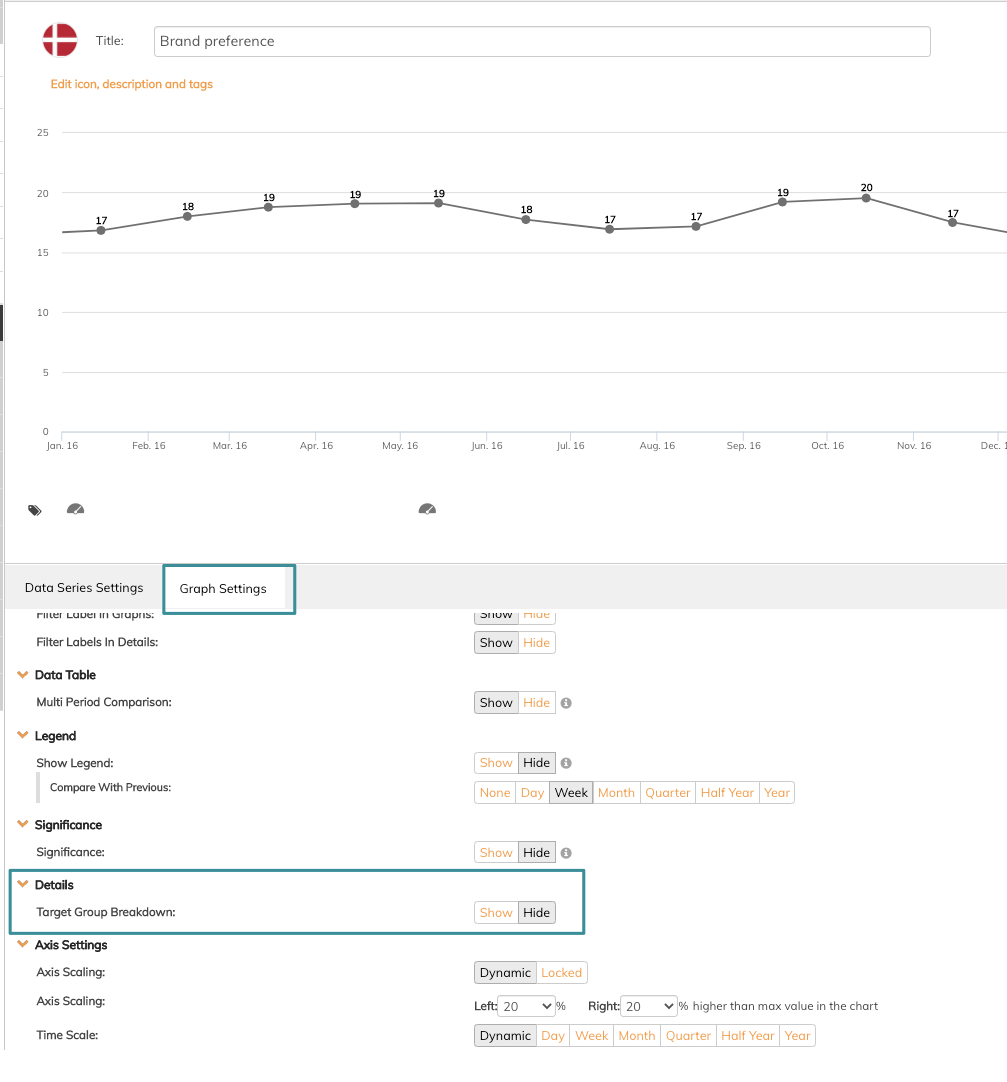
Navigate to Details
3. Click Show on Targetgroup breakdown
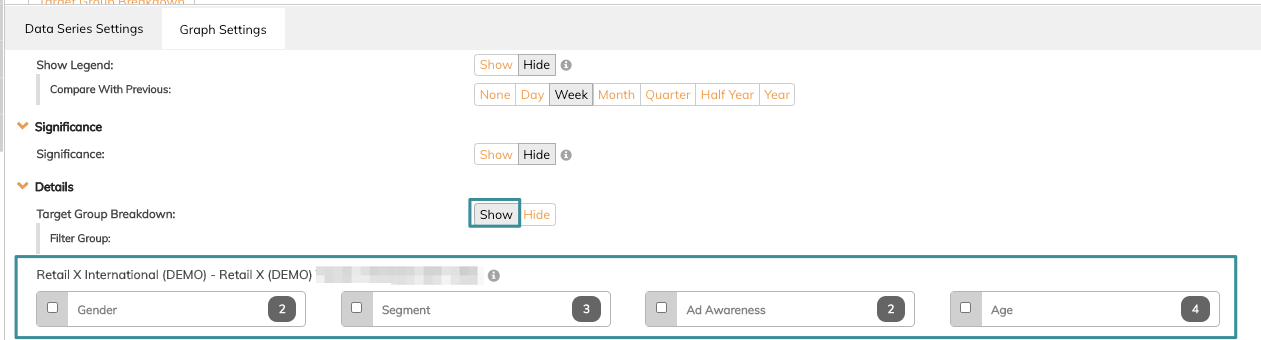
Filter groups created in the dashboard will now appear and you can choose to add the filters you want. Read this article if you want to learn how to create filters.
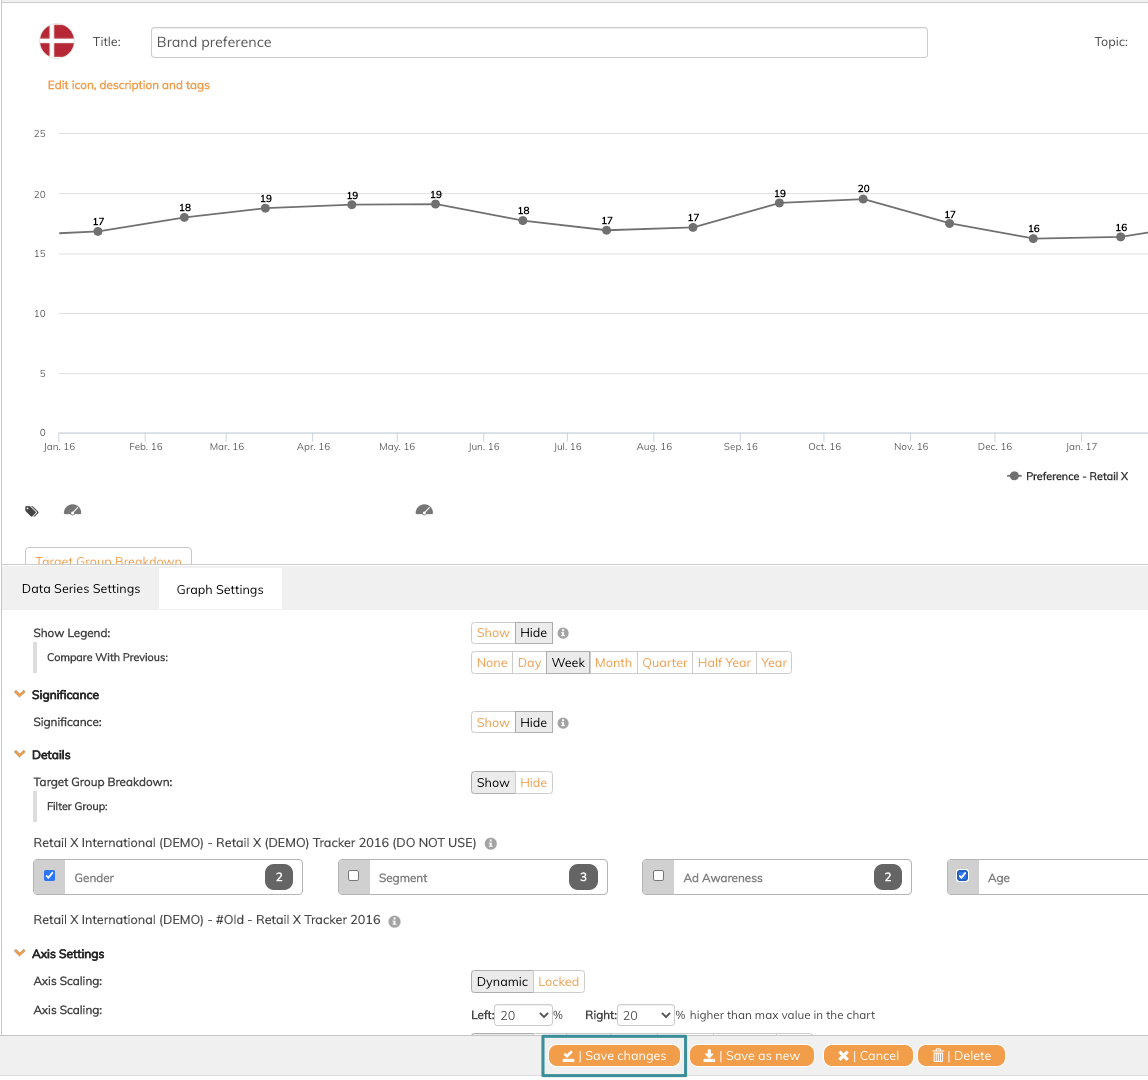
In the example below, we have added gender and age.
4. Click Save changes
Now the target group breakdown button is enabled in the graph.
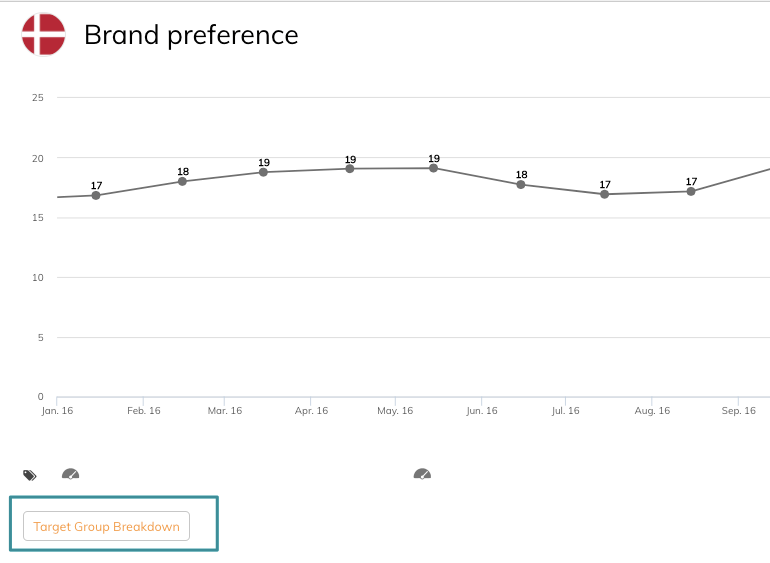
5. Click Target Group Breakdown
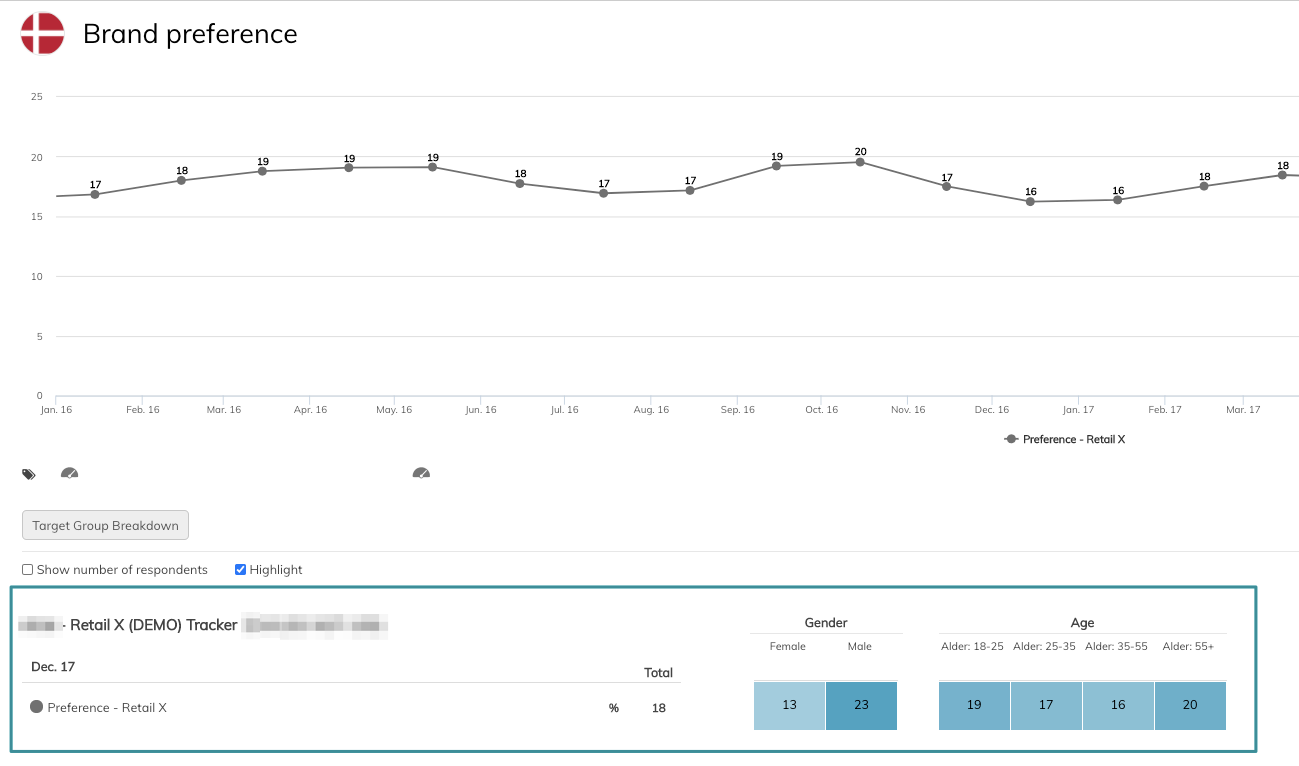
Now you can see the data series broken down to the chosen filters in graph settings.
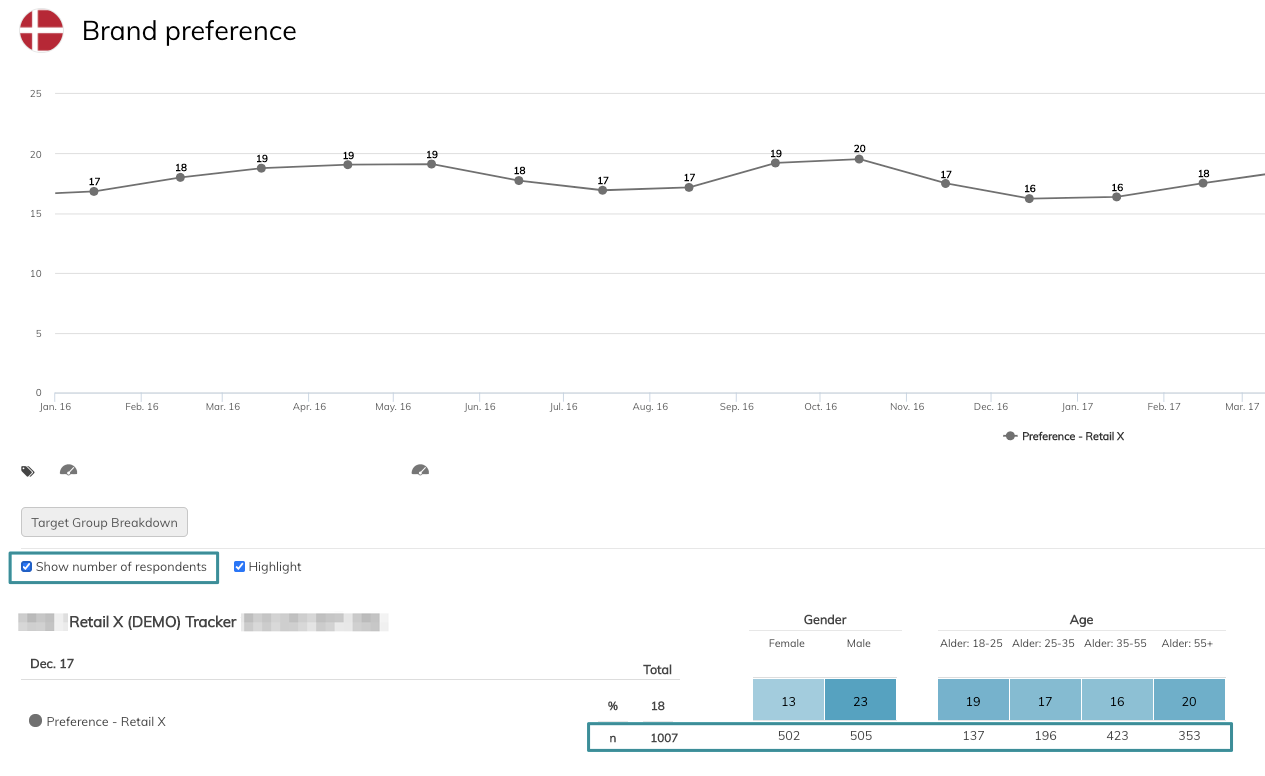
It is also possible to tick off Show number of respondents. If ticked off, you will see the number of respondents in each breakdown.
If you have any questions, do not hesitate to contact us on support@penetrace