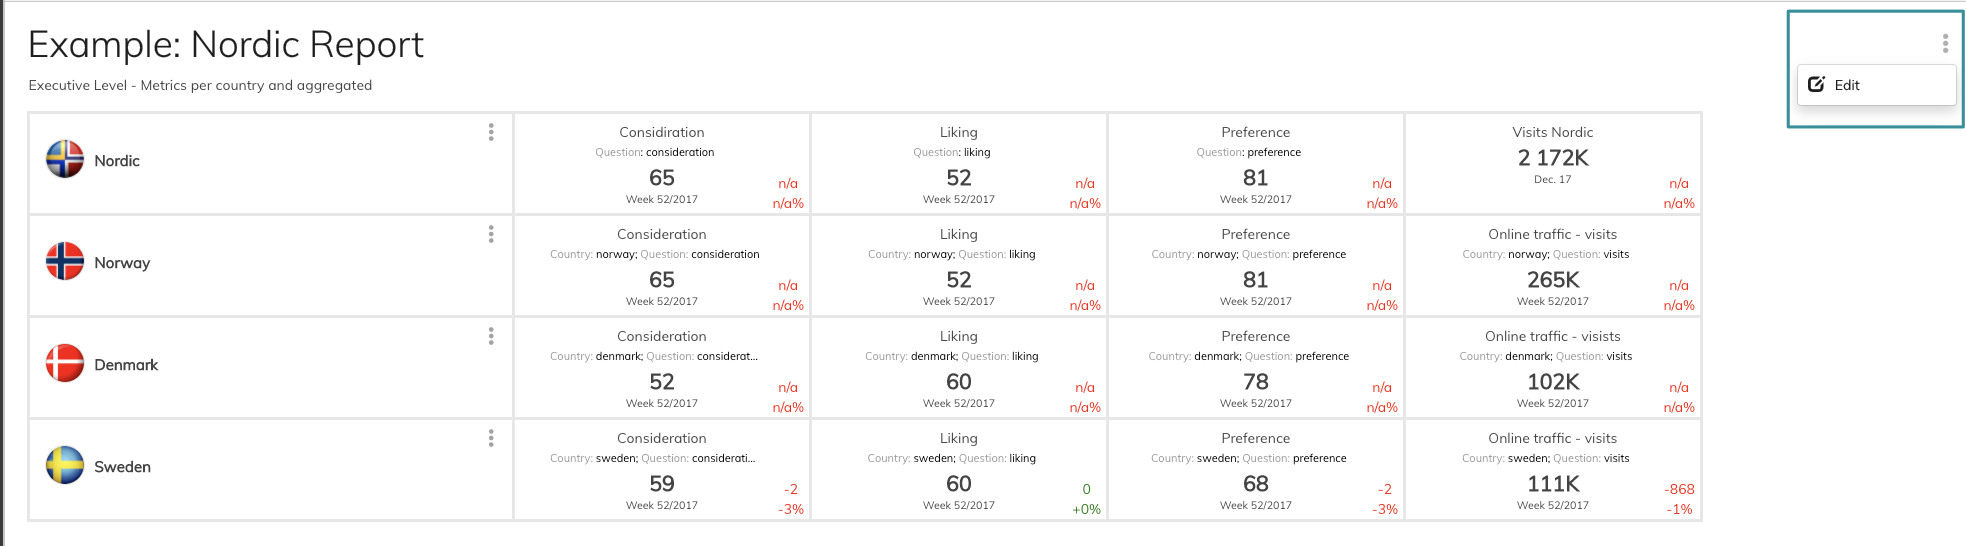
Gives a quick overview of your topics most important KPIs
With Topic Highlight you can set focus on chosen KPIs. Topic highlight gives you the possibility to create a table where you easily get a quick overview of your most important KPIs or can compare your brand against competitor or brand status in other countries.
To be able to create a Topic Highlight the following needs to be in place:
- Access to your dashboard
- Editor or Admin access rights
- A set of graphs to add to Topic Highlight
Follow these steps to create a Topic Highlight:
1. Click Edit in a Topic
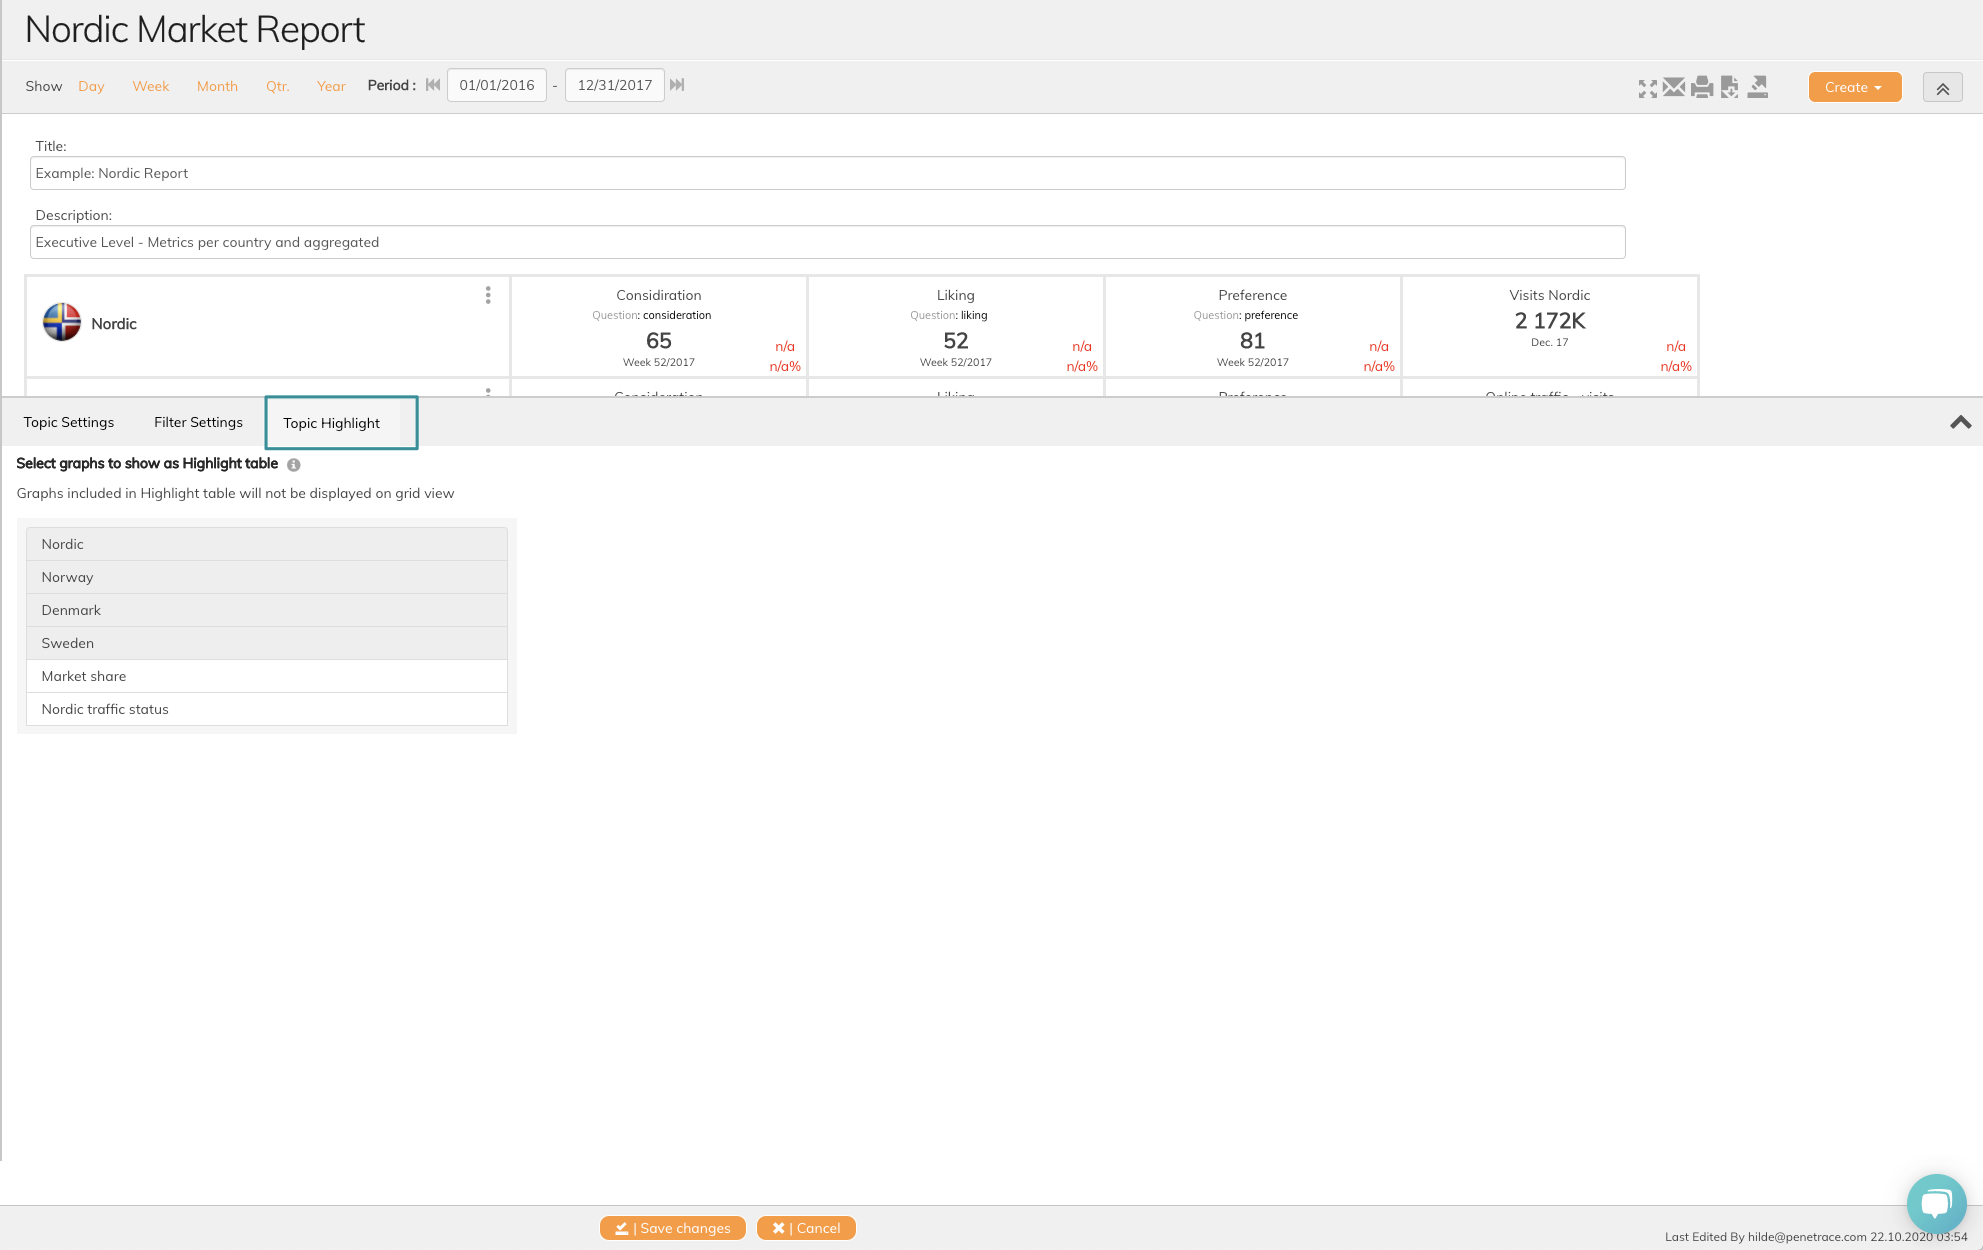
You are now in topic edit mode
2. Click Topic Highlight
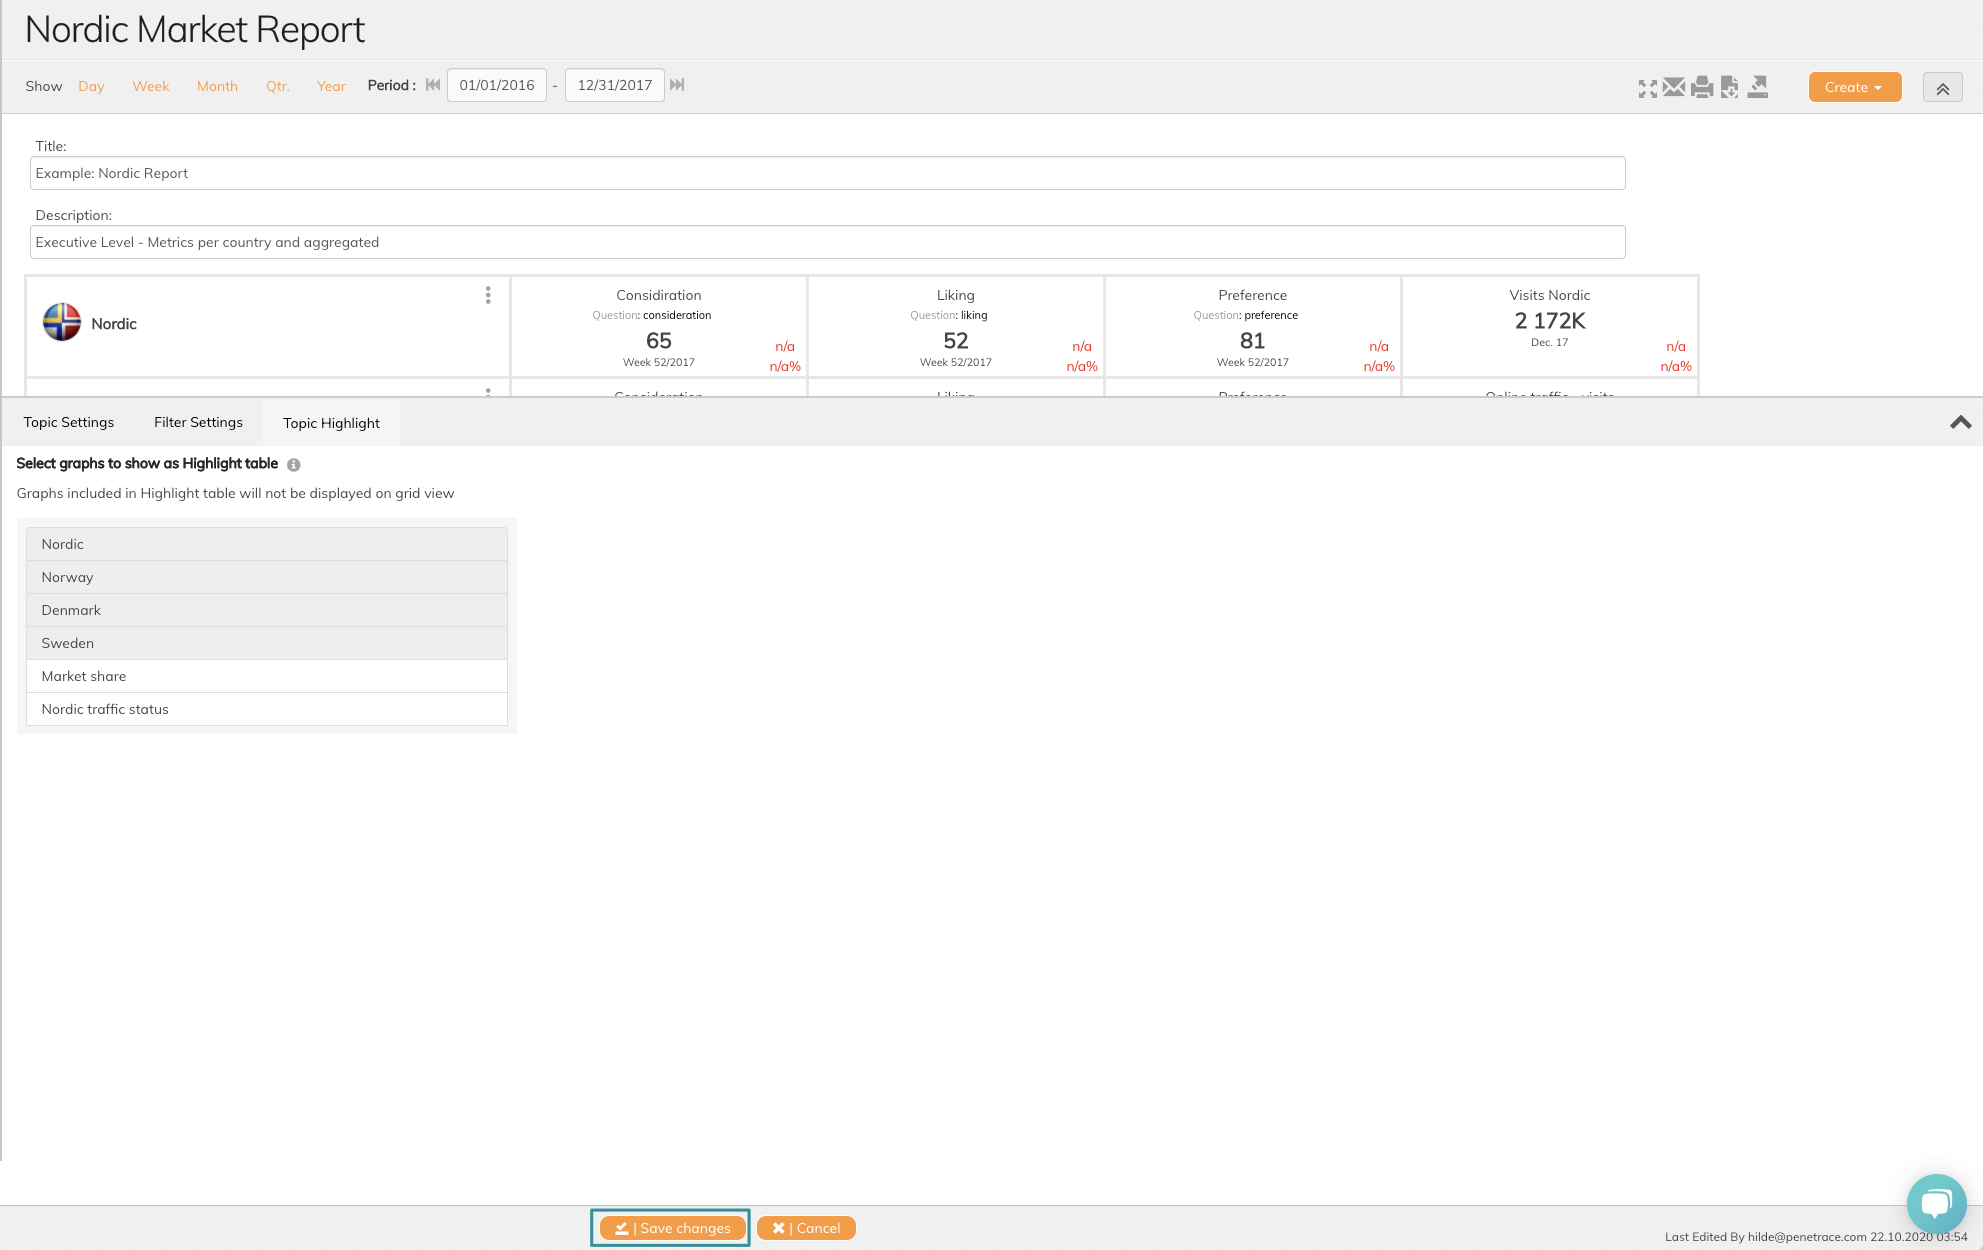
3. Click Save changes
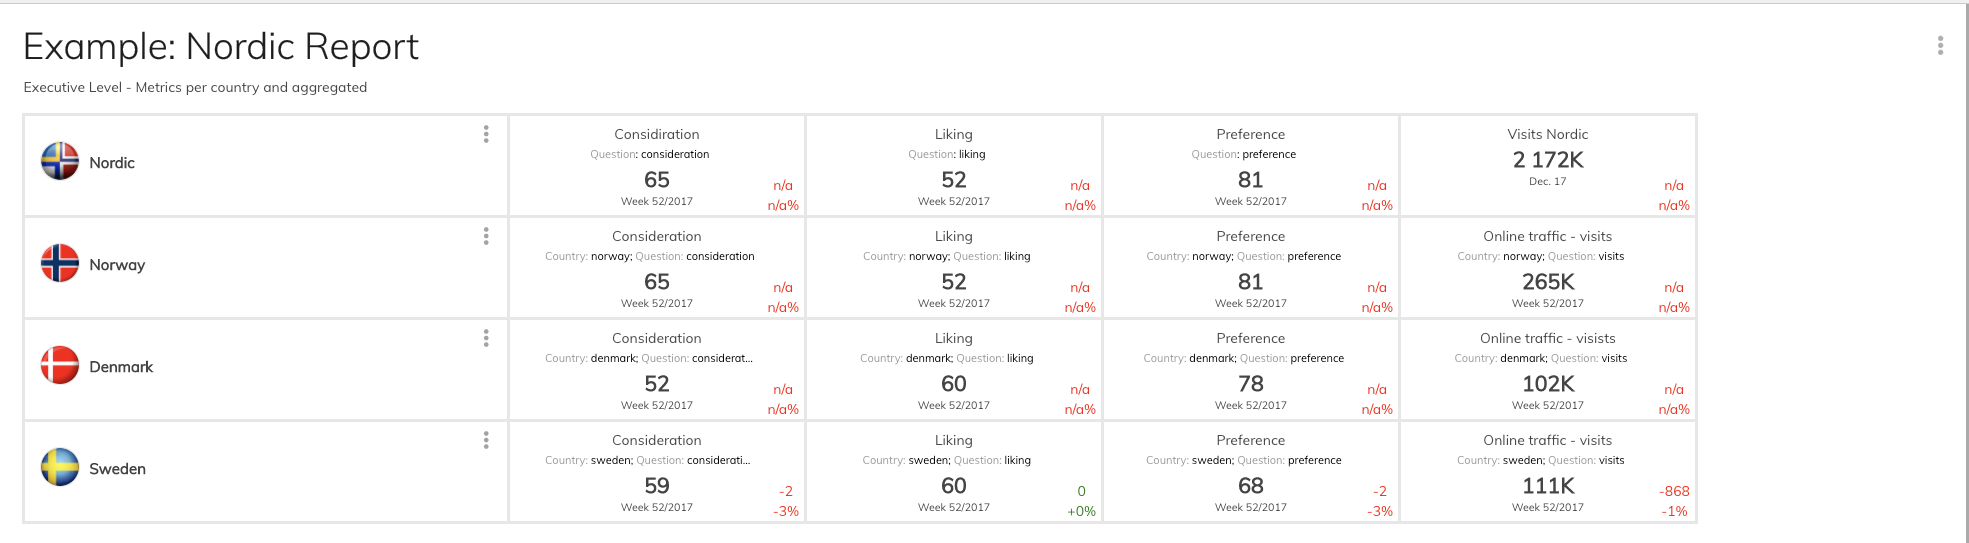
In this view, you can see all graphs on the topic. Simply click on the ones you want to be highlighted in your topic. In this example, we have added the graphs Nordic, Norway, Denmark and Sweden. See the Topic Highlight view below
Read this article if you want to know how to build a dashboard with micrographs.
If you have any questions, do not hesitate to contact us on support@penetrace