You can customize data series to add your brands look and feel to the graphs
Applies to Trend Monitor
To be able to do changes in data series the following must be in place:
- Access to your dashboard
- Edit access rights
- Data series must be added to a graph
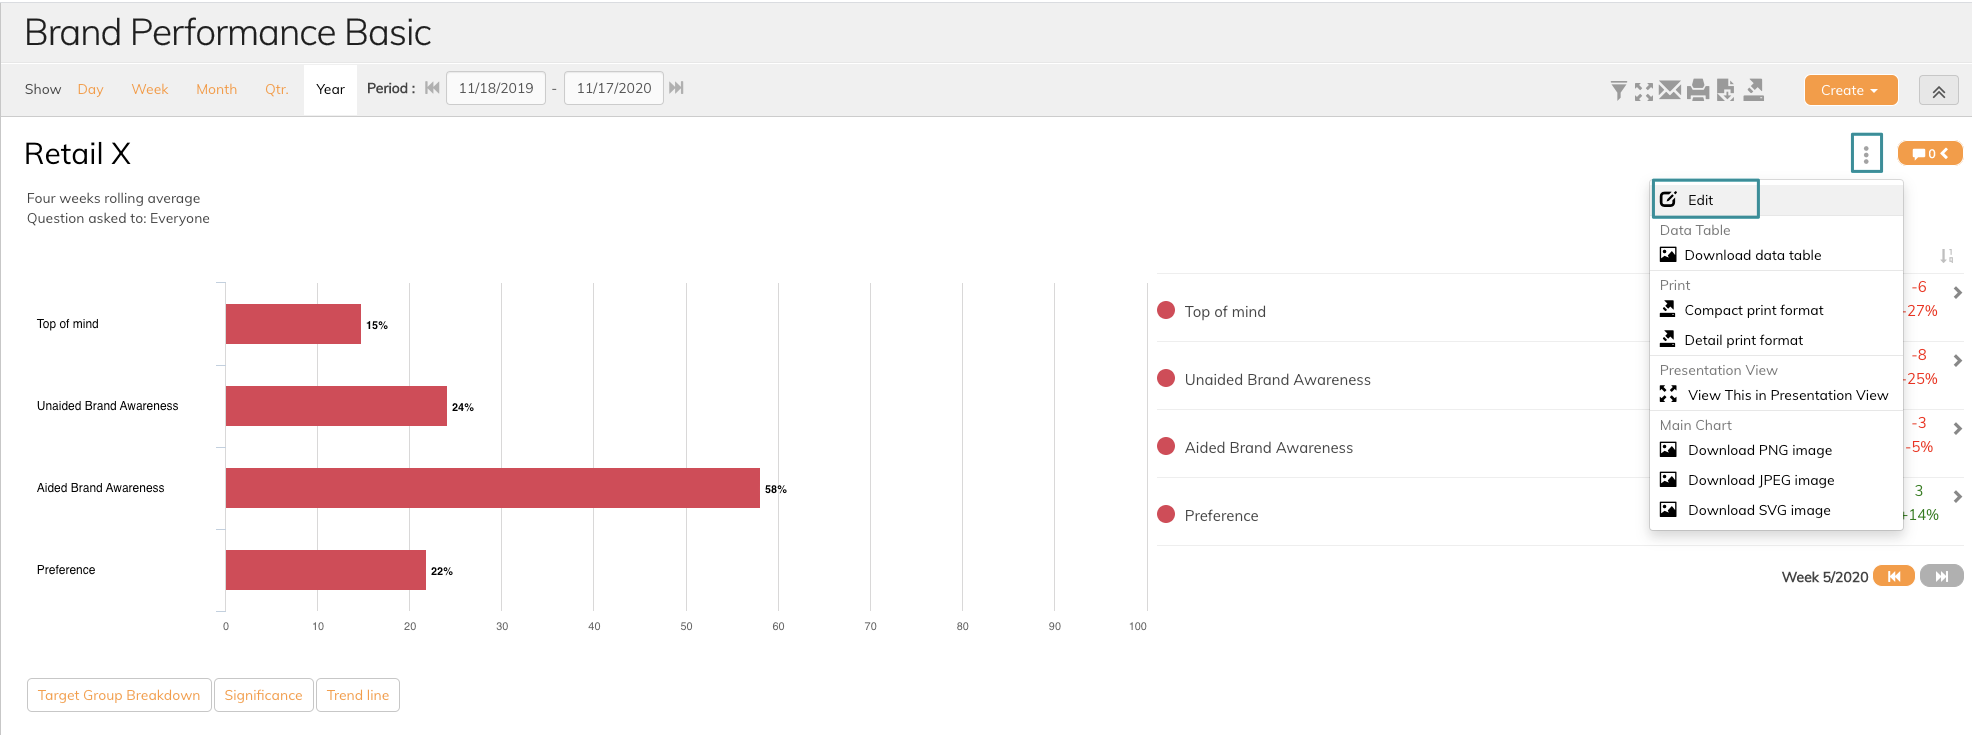
Follow these steps to change colours on data series:
1. Click Edit on a graph
2. Click on the colour set for the data series
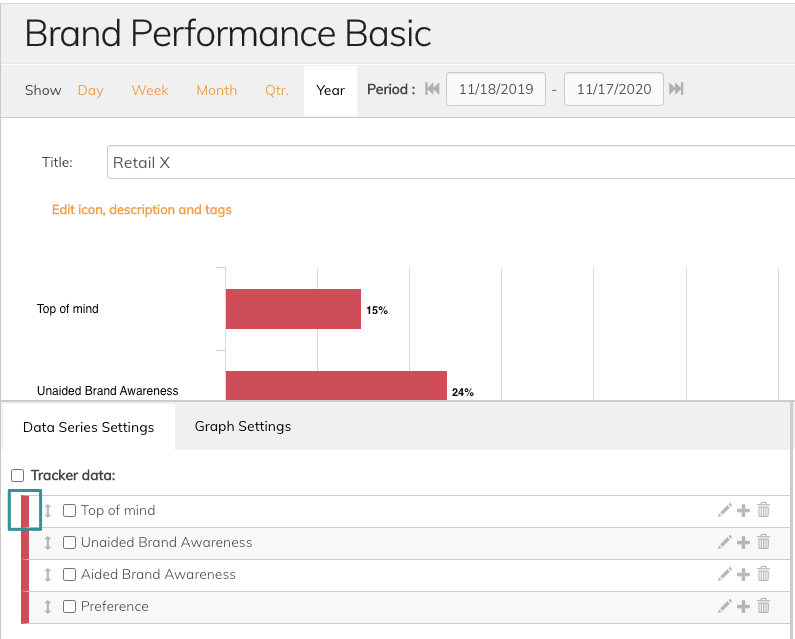
Then you enter the edit mode for colours.
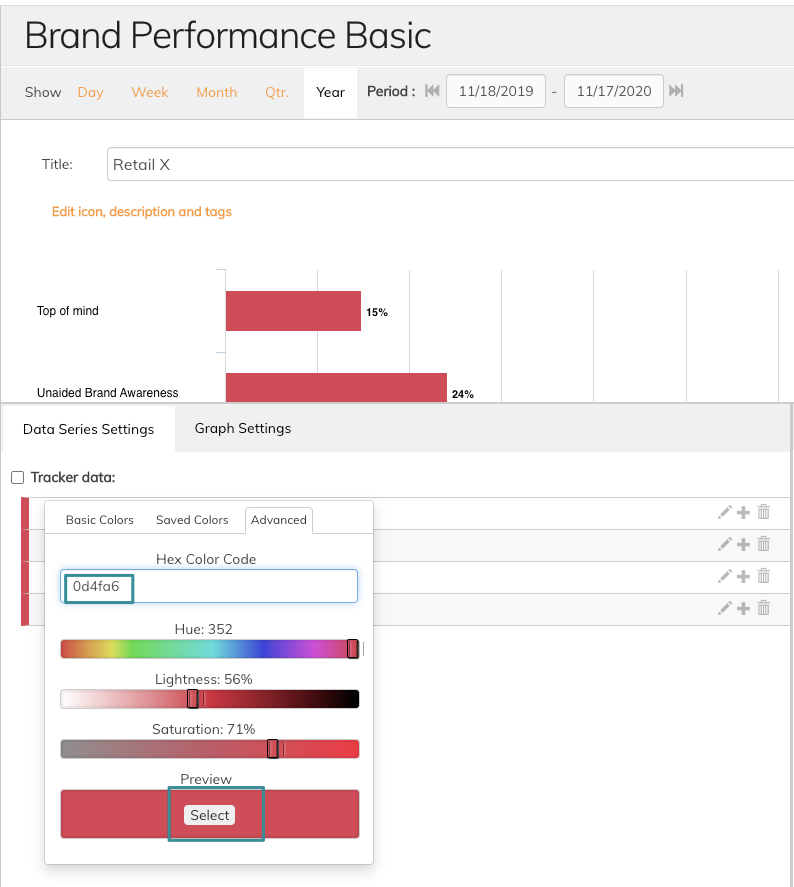
4. You can choose between Basic, Saved and Advanced Colours
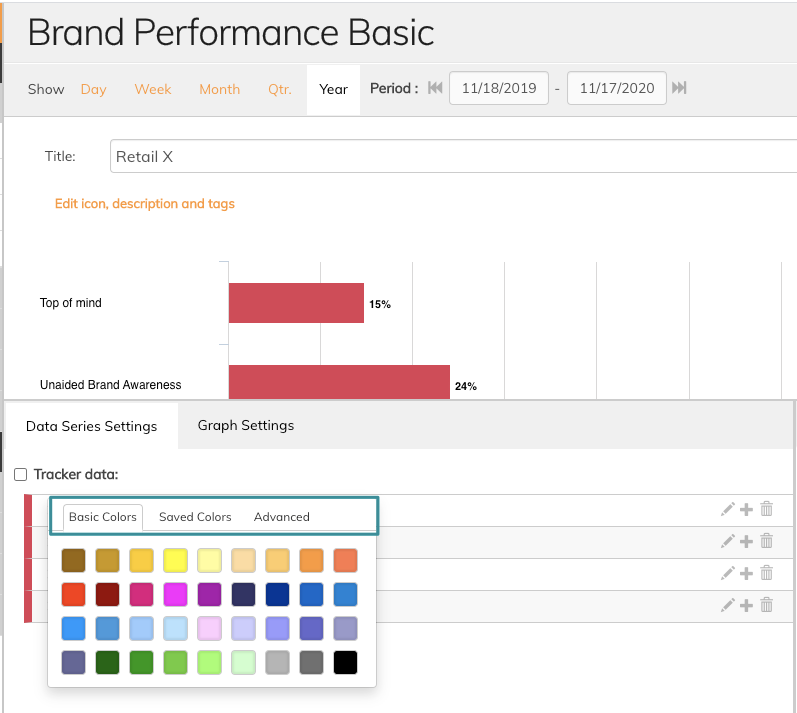
Basic colours refer to all default colours available in Penetrace. Saved colours refer to previously chosen colours by the user of Penetrace. Finally, Advanced colours refer to the area where you can enter your brand-specific colours by using hex-code.
5. Choose a colour
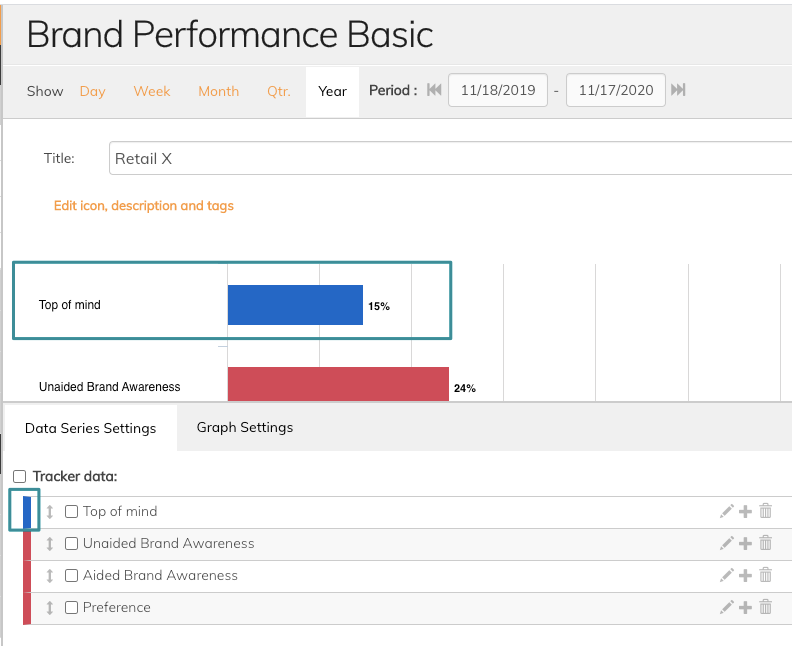
You will immediately see that the colour changes to what you chose.
If using Advanced colours, be aware that you need to click Preview to change the colour. See image below.
Read more about design amendments in these articles on icons or images
If you have any questions, do not hesitate to contact us on support@penetrace